
Page 63 - GTM-3-1
P. 63
Global Translational Medicine Reproductive hormones and muscle in obesity
Table 3. The cross‑sectional area of muscle fibers and total edema area in rat muscle tissues based on morphological analysis
Index Male rats Female rats
Control (n = 13) HCD (n = 14) Control (n = 14) HCD (n = 13)
Muscle fiber area (μm ) 1547 (1198; 2074) 1249 (859; 1694)**** 1878 (1397; 2544) 1060 (851; 1420) ####
2
Total edema area (%) 4.03 (3.12; 4.95) 11.13 (9.42; 12.07)**** 4.40 (3.00; 7.77) 10.68 (8.02; 13.16) ####
th
Note: Data are presented as median (25 percentile; 75 percentile); statistically significant difference between the male HCD and male control groups
th
at ****P<0.0001; statistically significant difference between the female HCD and female control groups at #### P<0.0001.
Abbreviation: HCD: High-calorie diet.
Table 4. Biochemical parameters in the musculus triceps surae tissues of the experimental animals
Index Male rats Female rats
Control (n = 13) HCD (n = 14) Control (n = 14) HCD (n = 13)
Total protein (mg/g tissue) 46.20 (41.00; 48.60) 51.10 (47.40; 53.80)* 62.60 (61.90; 62.80) 60.30 (54.80; 61.40) #
Cholesterol (μmol/g tissue) 1.00 (0.90; 1.10) 1.10 (1.00; 1.20)* 0.77 (0.69; 0.84) 0.62 (0.61; 0.79) #
Triglycerides (μmol/g tissue) 12.90 (9.30; 17.70) 14.95 (13.30; 16.10) 9.30 (7.70; 12.60) 11.90 (8.70; 14.10)
Glucose (μmol/g tissue) 1.70 (1.60; 2.00) 2.30 (1.90; 2.50)** 2.79 (2.61; 2.97) 2.85 (2.72; 2.99)
Lactate (μmol/g tissue) 30.49 (26.62; 33.80) 38.94 (34.67; 48.02)** 45.30 (39.80; 51.90) 41.20 (31.90; 45.20) #
Lactate dehydrogenase (U/g tissue) 619.00 (584.00; 688.00) 808.50 (748.00; 922.00)** 772.00 (746.00; 834.00) 685.00 (655.00; 765.00)
3
Creatine kinase (U/g tissue × 10 ) 7.80 (6.19; 8.72) 7.89 (7.39; 8.77) 5.25 (4.72; 7.05) 4.28 (3.57; 4.41) ##
Malonic dialdehyde (μmol/g tissue) 18.88 (17.21; 20.51) 23.69 (20.54; 28.73)** 23.79 (6.39; 46.01) 40.76 (34.00; 63.97) #
Superoxide dismutase (U/ml) 36.21 (31.49; 42.30) 46.93 (42.67; 49.89)** 36.57 (32.14; 40.25) 33.82 (32.39; 37.64)
Note: Data are presented as median (25 percentile; 75 percentile); statistically significant differences between the male HCD and male control groups
th
th
##
#
at *P < 0.05 and **P < 0.01; statistically significant differences between the female HCD and female control groups at P < 0.05 and P < 0.01.
Abbreviation: HCD: High-calorie diet.
A B It has been reported that changes in metabolic
processes in the muscle tissue can be associated with
anabolic hormones in the blood and muscle tissues (from
extragonadal synthesis). Based on this information,
8
estradiol and testosterone were determined in muscle
tissue homogenates from male and female rats. The
level of testosterone and estradiol in the muscle tissue
C D of male rats did not change regardless of the type of diet
(Table 5). However, there was a significant increase in the
concentration of estradiol in the musculus triceps surae
of obese female rats (P = 0.003), and the estradiol level in
the musculus triceps surae of female rats from both groups
was higher than in the male rats. The testosterone levels in
the musculus triceps surae of male and female rats of all
experimental groups were comparable.
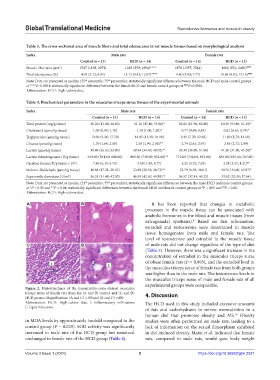
Figure 2. Histostructures of the hematoxylin-eosin-stained musculus
triceps surae of female rats from the (A and B) control and (C and D) 4. Discussion
HCD groups. Magnification: (A and C) ×100 and (B and D) ×400.
Abbreviation: HCD: High-calorie diet; I: Inflammatory infiltration; The HCD used in this study included excessive amounts
L: Lipid inclusions.
of fats and carbohydrates to mimic overnutrition in a
16
human diet that promotes obesity and MS. Obesity
in MDA levels by approximately twofold compared to the studies were often performed on male rats, leading to a
control group (P = 0.029). SOD activity was significantly lack of information on the sexual dimorphism exhibited
increased in male rats of the HCD group but remained in diet-induced obesity. Maric et al. indicated that female
unchanged in female rats of the HCD group (Table 4). rats, compared to male rats, would gain body weight
Volume 3 Issue 1 (2024) 5 https://doi.org/10.36922/gtm.2321