
Page 71 - GTM-3-1
P. 71
Global Translational Medicine Evaluating ML models for CAD prediction
a cutoff of 200 mg/dL, and exercise-induced angina was same code with the same session ID. The target refers to the
categorized as either “yes” or “no,” depending on the column in the dataset (the CSV file) that will be predicted.
presence or absence of chest pain during exertion. In this case, the target is named “HeartDZ.” The target type
Chest pain type and resting ECG were categorical specifies the nature of the target variable, which, in this case,
variables with multiple choices. Chest pain type was is “Binary;” this means that the target variable has an output
categorized as typical (TA), atypical (ATA), non-anginal of either 1 (presence of heart disease) or 0 (absence of heart
pain (NAP), and asymptomatic (ASY). Resting ECG disease). The original data shape shows the dimensions of
was categorized as normal, ST for having ST-T wave the dataset before any transformations, with 1049 rows and
abnormalities (T wave inversions and/or ST elevation or eight columns, meaning that there were 1049 individual
depression of >0.05 mV), and left ventricular hypertrophy patients, and there were nine parameters (age, sex, chest
if patients showed probable or definite left ventricular pain type, resting blood pressure, cholesterol, fasting blood
hypertrophy by Estes’ criteria. Some variables from the sugar, resting ECG, exercise angina, and HeartDZ). The
separate datasets were excluded due to variations in data transformed data shape has 1049 rows and 14 columns
collection and if they differed between datasets. The nine as the categorical variables (chest pain type and resting
variables mentioned above were common across all three ECG) were converted to binary outputs depending on the
datasets. number of categories present. For example, chest pain was
converted from one column to four columns, and resting
2.2. PyCaret setup ECG was converted from one column to three columns;
PyCaret Classification Module is a supervised ML tool for altogether, there are 14 columns (age, sex, chest pain
predicting categorical class labels, particularly discrete and type ASY, chest pain type NAP, chest pain type ATA, chest
unordered ones. It handles binary and multiclass problems pain type TA, resting blood pressure, cholesterol, fasting
adeptly, finding applications in diverse scenarios. The blood sugar, resting ECG of left ventricular hypertrophy,
standard PyCaret classification workflow involves five resting ECG Normal, resting ECG ST, exercise angina,
key steps: set up, compare models, analyze model, save and HeartDZ). The transformed train set shape indicates
model, and predict. The initial step, “set up,” establishes that the training dataset contains 734 observations after
the training environment and constructs a transformation preprocessing (~70% of the total dataset) used to train
pipeline. This stage requires two essential parameters, the ML models. The transformed test set shape indicates
“data” and “target,” with additional optional parameters that the test dataset contains 315 observations after
for customization. The user organizes the data cohesively, preprocessing (~30% of the total dataset) used to evaluate
ensuring that the target variable is appropriately labeled. the performance of the trained models.
The data, supplied in comma-separated values (CSV) The original dataset was transformed through the
format, conforms to a binary classification model, where addition of several preprocessing steps, including simple
the target is numerically represented (0 for no diagnosis of imputer (1 step), simple imputer (2 step), ordinal encoder,
st
nd
heart disease, and 1 for the presence of heart disease).
and one-hot encoder. The simple imputer (1 and 2 steps)
st
nd
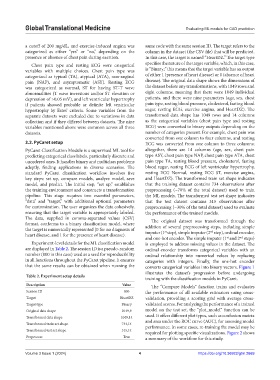
Experiment-level details for the ML classification model is employed to address missing values in the dataset. The
are displayed in Table 2. The session ID is a pseudo-random ordinal encoder transforms categorical variables with an
number (000 in this case) used as a seed for reproducibility ordinal relationship into numerical values by replacing
in all functions throughout the PyCaret pipeline. It ensures categories with integers. Finally, the one-hot encoder
that the same results can be obtained when running the converts categorical variables into binary vectors. Figure 1
illustrates the dataset’s progression before undergoing
Table 2. Experiment setup details
training with the classification models in PyCaret.
Description Value The “Compare Models” function trains and evaluates
Session ID 000 the performance of all available estimators using cross-
Target HeartDZ validation, providing a scoring grid with average cross-
Target type Binary validated scores. For analyzing the performance of a trained
Original data shape 1049,9 model on the test set, the “plot_model” function can be
Transformed data shape 1049,14 used. It offers different plot types, such as confusion matrix
Transformed train set shape 734,14 and area under the ROC curve (AUC), for assessing model
performance. In some cases, re-training the model may be
Transformed test set shape 315,14 required for plotting specific visualizations. Figure 2 shows
Preprocess True a summary of the workflow for this study.
Volume 3 Issue 1 (2024) 4 https://doi.org/10.36922/gtm.2669