
Page 74 - GTM-3-1
P. 74
Global Translational Medicine Evaluating ML models for CAD prediction
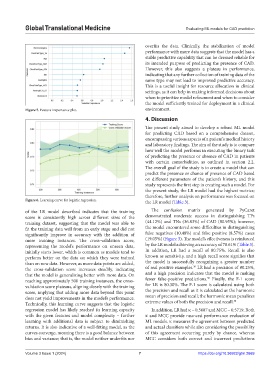
overfits the data. Clinically, the stabilization of model
performance with more data suggests that the model has a
stable predictive capability that can be deemed reliable for
its intended purpose of predicting the presence of CAD.
However, this also suggests a plateau in performance,
indicating that any further collection of training data of the
same type may not lead to improved predictive accuracy.
This is a useful insight for resource allocation in clinical
settings, as it can help in making informed decisions about
when to prioritize model refinement and when to consider
the model sufficiently trained for deployment in a clinical
Figure 5. Feature importance plot. environment.
4. Discussion
The present study aimed to develop a robust ML model
for predicting CAD based on a comprehensive dataset,
encompassing various aspects of a patient’s medical history
and laboratory findings. The aim of the study is to compare
how well the model performs in executing the binary task
of predicting the presence or absence of CAD in patients
with certain comorbidities, as outlined in section 2.2.
The overall goal of the study is to create a model that can
predict the presence or chance of presence of CAD based
on different parameters of the patient’s history, and this
study represents the first step in creating such a model. For
the present study, the LR model had the highest metrics;
therefore, further analysis on performance was focused on
Figure 6. Learning curve for logistic regression. the LR model (Table 3).
of the LR model described indicates that the training The confusion matrix generated by PyCaret
score is consistently high across different sizes of the demonstrated moderate success in distinguishing TPs
training dataset, suggesting that the model was able to (44.12%) and TNs (36.83%) of CAD (80.95%); however,
fit the training data well from an early stage and did not the model encountered some difficulties in distinguishing
significantly improve in accuracy with the addition of false negatives (10.48%) and false positive (8.57%) cases
more training instances. The cross-validation score, (19.05%) (Figure 3). The model’s effectiveness is reinforced
representing the model’s performance on unseen data, by the LR model achieving an accuracy of 78.61% (Table 3).
initially starts lower, which is common as models tend to In addition, LR had a recall of 80.75%. Recall is also
perform better on the data on which they were trained known as sensitivity, and a high recall score signifies that
than on new data. However, as more data points are added, the model is successfully recognizing a greater number
30
the cross-validation score increases steadily, indicating of real positive examples. LR had a precision of 80.25%,
that the model is generalizing better with more data. On and a high precision indicates that the model is making
30
reaching approximately 500 training instances, the cross- fewer false-positive predictions. Finally, the F-1 score
validation score plateaus, aligning closely with the training for LR is 80.30%. The F-1 score is calculated using both
score, implying that adding more data beyond this point the precision and recall as it is calculated as the harmonic
does not yield improvements in the model’s performance. mean of precision and recall; the harmonic mean penalizes
30
Technically, this learning curve suggests that the logistic extreme values of both the precision and recall.
regression model has likely reached its learning capacity In addition, LR had κ = 0.5687 and MCC = 0.5719. Both
with the given features and model complexity – further κ and MCC provide nuanced performance evaluation of
learning with additional data is subject to diminishing ML models. κ measures the agreement between predicted
returns. It is also indicative of a well-fitting model, as the and actual classifiers while also considering the possibility
curves converge, meaning there is a good balance between of this agreement occurring purely by chance, whereas
bias and variance; that is, the model neither underfits nor MCC considers both correct and incorrect predictions
Volume 3 Issue 1 (2024) 7 https://doi.org/10.36922/gtm.2669