
Page 72 - GTM-3-1
P. 72
Global Translational Medicine Evaluating ML models for CAD prediction
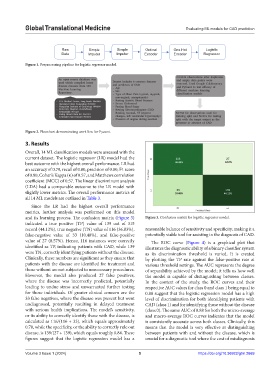
Raw Simple Simple Ordinal One Hot Logistic
Data Imputer Imputer Encoder Encoder Regressor
Figure 1. Preprocessing pipeline for logistic regressor model.
Figure 2. Flowchart demonstrating workflow for Pycaret.
3. Results
Overall, 14 ML classification models were assessed with the
current dataset. The logistic regressor (LR) model had the
best outcome with the highest overall performance. LR had
an accuracy of 0.79, recall of 0.80, precision of 0.80, F1 score
of 0.80, Cohen’s Kappa (κ) of 0.57, and Matthews correlation
coefficient (MCC) of 0.57. The linear discriminant analysis
(LDA) had a comparable outcome to the LR model with
slightly lower metrics. The overall performance metrics of
all 14 ML models are outlined in Table 3.
Since the LR had the highest overall performance
metrics, further analysis was performed on this model
and its learning process. The confusion matrix (Figure 3) Figure 3. Confusion matrix for logistic regressor model.
indicated a true positive (TP) value of 139 out of 315
record (44.12%), true negative (TN) value of 116 (36.83%), reasonable balance of sensitivity and specificity, making it a
false-negative value of 33 (10.48%), and false-positive potentially viable tool for assisting in the diagnosis of CAD.
value of 27 (8.57%). Hence, 116 instances were correctly The ROC curve (Figure 4) is a graphical plot that
identified as TP, indicating patients with CAD, while 139 illustrates the diagnostic ability of a binary classifier system
were TN, correctly identifying patients without the disease. as its discrimination threshold is varied. It is created
Clinically, these numbers are significant as they ensure that by plotting the TP rate against the false-positive rate at
patients with the disease are identified for treatment and various threshold settings. The AUC represents the degree
those without are not subjected to unnecessary procedures. of separability achieved by the model; it tells us how well
However, the model also produced 27 false positives, the model is capable of distinguishing between classes.
where the disease was incorrectly predicted, potentially In the context of the study, the ROC curves and their
leading to undue stress and unwarranted further testing respective AUC values for class 0 and class 1 being equal to
for those individuals. Of greater clinical concern are the 0.88 suggest that the logistic regression model has a high
33 false negatives, where the disease was present but went level of discrimination for both identifying patients with
undiagnosed, potentially resulting in delayed treatment CAD (class 1) and for identifying those without the disease
with serious health implications. The model’s sensitivity, (class 0). The same AUC of 0.88 for both the micro-average
or its ability to correctly identify those with the disease, is and macro-average ROC curves indicates that the model
calculated as 116/(116 + 33), which equals approximately is consistently accurate across both classes. Clinically, this
0.78, while the specificity, or the ability to correctly rule out means that the model is very effective at distinguishing
disease, is 139/(27 + 139), which equals roughly 0.84. These between patients with and without the disease, which is
figures suggest that the logistic regression model has a crucial for a diagnostic tool where the cost of misdiagnosis
Volume 3 Issue 1 (2024) 5 https://doi.org/10.36922/gtm.2669