
Page 70 - GTM-3-1
P. 70
Global Translational Medicine Evaluating ML models for CAD prediction
has many risks and limitations regarding screening large 2. Materials and methods
populations. Due to these reasons, along with the recent
advancements in artificial intelligence, researchers have 2.1. Data collection and processing
been turning to ML prediction models to aid in the early A combination of open-source online databases was used
detection of CAD. In our study, we have utilized a vast to train and test the ML models. Datasets were derived from
amount of data, incorporating 918 datasets and evaluated the UC Irvine ML Repository 5,6,28,29 and were externally
the performance of 14 ML models in accurately detecting curated through “fedesoriano” on Kaggle.com and by the
and predicting CAD based on 11 factors. By doing so, we authors. The first dataset comprises information from
aim to contribute to the continuously growing pool of five discrete heart-related datasets: Cleveland (n = 303),
research on artificial intelligence in healthcare and provide Hungarian (n = 294), Switzerland (n = 123), Long Beach,
insights into the effectiveness of ML models in early CAD VA (n = 200), and Stalog (Heart) Data Set (n = 270). This
detection. combined dataset included 11 common features and
Hence, in this study, the PyCaret Classification Module, predictors of CAD: age, sex, chest pain type, resting systolic
a tool for supervised ML, was used to compare various blood pressure, serum cholesterol, fasting blood sugar,
classification models for predicting the presence of CAD. resting electrocardiogram (ECG) reading, maximum
After setting up the data, transforming it, and separating it heart rate, presence of angina during exercise, oldpeak
into training and test sets, the “Compare Models” function (ST depression induced by exercise relative to rest), and
in PyCaret trained and evaluated the performance of all ST sloping. To improve the generalizability of the model,
available estimators using cross-validation. This process another dataset called “Z-Alizadeh Sani” and its extension
5,6
included a scoring grid with average cross-validated were added (n = 303), and extraneous variables were
scores based on metrics pertinent to classification model removed to form the final dataset comprising variables
evaluation. Out of 14 ML classification models assessed, such as sex, chest pain type, resting blood pressure,
the logistic regressor model emerged as the most effective, cholesterol, fasting blood sugar, resting ECG, and presence
yielding the highest overall performance. The logistic of angina during exercise, with the presence or absence of
regression model’s effectiveness has been appraised against a diagnosis of heart disease as the target variable (Table 1).
standard metrics such as accuracy, sensitivity, specificity, Age, sex, cholesterol, and exercise angina were represented
and the area under the receiver operating characteristic as binary variables. Age was delineated as above or below
(ROC) curve, indicative of its capability to differentiate the the age of 55, sex was categorized based on sex assigned
presence or absence of CAD. at birth (male or female), cholesterol was stratified with
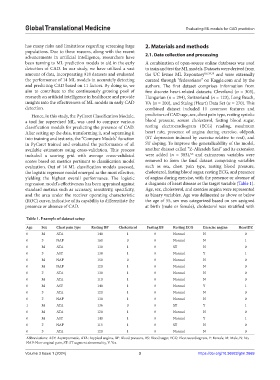
Table 1. Example of dataset setup
Age Sex Chest pain type Resting BP Cholesterol Fasting BS Resting ECG Exercise angina HeartDZ
0 M ATA 140 1 0 Normal N 0
0 F NAP 160 0 0 Normal N 1
0 M ATA 130 1 0 ST N 0
0 F ASY 138 1 0 Normal Y 1
0 M NAP 150 0 0 Normal N 0
0 M NAP 120 1 0 Normal N 0
0 F ATA 130 1 0 Normal N 0
0 M ATA 110 1 0 Normal N 0
0 M ASY 140 1 0 Normal Y 1
0 F ATA 120 1 0 Normal N 0
0 F NAP 130 1 0 Normal N 0
1 M ATA 136 0 0 ST Y 1
0 M ATA 120 1 0 Normal N 0
0 M ASY 140 1 0 Normal Y 1
0 F NAP 115 1 0 ST N 0
0 F ATA 120 1 0 Normal N 0
Abbreviations: ASY: Asymptomatic, ATA: Atypical angina, BP: Blood pressure, BS: Blood sugar, ECG: Electrocardiogram, F: Female, M: Male, N: No,
NAP: Non-anginal pain, ST: ST segment abnormality, Y: Yes.
Volume 3 Issue 1 (2024) 3 https://doi.org/10.36922/gtm.2669