
Page 73 - GTM-3-1
P. 73
Global Translational Medicine Evaluating ML models for CAD prediction
Table 3. Performance of all machine learning classification models
Model Accuracy Recall Precision F1‑Score Kappa MCC
Logistic regression (LR) 0.7861 0.8075 0.8025 0.8030 0.5687 0.5719
Linear discriminant analysis (LDA) 0.7834 0.7950 0.8059 0.7984 0.5641 0.5674
Ridge classifier (RIDGE) 0.7820 0.7950 0.8040 0.7974 0.5612 0.5646
AdaBoost classifier (ADA) 0.7793 0.8000 0.7975 0.7967 0.5550 0.5584
Gradient Boost classifier (GBC) 0.7765 0.8075 0.7897 0.7968 0.5481 0.5516
Naive Bayes (NB) 0.7725 0.8000 0.7866 0.7923 0.5405 0.5423
Light Gradient Boosting Machine (LGBM) 0.7628 0.7950 0.7761 0.7851 0.5205 0.5214
Extreme Gradient Boosting (XGBOOST) 0.7559 0.7725 0.7815 0.7753 0.5077 0.5103
Random Forest classifier (RF) 0.7491 0.7675 0.7739 0.7683 0.4944 0.4980
Extra Trees classifier (ET) 0.7383 0.7350 0.7753 0.7530 0.4748 0.4776
K-nearest neighbor classifier (KNN) 0.7315 0.7575 0.7559 0.7551 0.4575 0.4597
Decision Tree classifier (DT) 0.7260 0.6975 0.7827 0.7347 0.4526 0.4592
Quadratic discriminant analysis (QDA) 0.6920 0.7550 0.7038 0.7215 0.3751 0.3886
Support vector machines–linear kernel (SVM-LK) 0.5670 0.5050 0.5095 0.4355 0.1401 0.1713
Abbreviation: MCC: Matthews correlation coefficient.
pain type ATA, which are arranged in descending order of
importance. Variables with lower importance in the context
of this model included sex, fasting blood sugar, chest pain
type ASY, resting ECG ST, and cholesterol, which are listed
in order of decreasing impact on the model’s predictions.
These findings imply that the occurrence of exercise-induced
angina (chest pain) and the type of chest pain categorized
as TA angina are the strongest predictors for CAD in this
logistic regression model. Age and other types of chest
pain, such as NAP and ATA angina, are also important
considerations, although they have less influence compared
to exercise angina and chest pain type TA. The factors of lesser
importance, such as patient’s gender, fasting blood sugar
levels, presence of asymptomatic chest pain, certain ECG
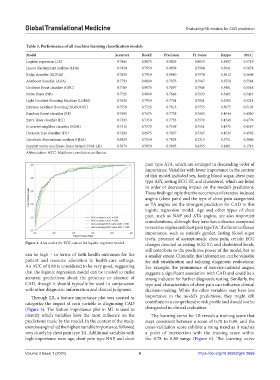
Figure 4. Area under the ROC curves for logistic regressor model. changes denoted as resting ECG ST, and cholesterol levels,
still contribute to the predictive power of the model, but to
can be high – in terms of both health outcomes for the a smaller extent. Clinically, this information can be valuable
patient and resource allocation in health-care settings. for risk stratification and tailoring diagnostic evaluations.
An AUC of 0.88 is considered to be very good, suggesting For example, the prominence of exercise-induced angina
that the logistic regression model can be trusted to make suggests a significant association with CAD and could be a
accurate predictions about the presence or absence of strong indicator for further diagnostic testing. Similarly, the
CAD, though it should typically be used in conjunction type and characteristics of chest pain can influence clinical
with other diagnostic information and clinical judgment. decision-making. While the other variables may have less
Through LR, a feature importance plot was created to importance in the model’s predictions, they might still
categorize the impact of each variable in diagnosing CAD contribute to a comprehensive risk profile and should not be
(Figure 5). The feature importance plot in ML is used to disregarded in clinical evaluation.
identify which variables have the most influence on the The learning curve for LR reveals a training score that
predictions made by the model. In the context of the study, stays consistent between a score of 0.78 to 0.80, and the
exercise angina had the highest variable importance, followed cross-validation score exhibits a rising trend as it reaches
very closely by chest pain type TA. Additional variables with a point of intersection with the training score within
high importance were age, chest pain type NAP, and chest the 0.78 to 0.80 range (Figure 6). The learning curve
Volume 3 Issue 1 (2024) 6 https://doi.org/10.36922/gtm.2669