
Page 102 - GTM-4-1
P. 102
Global Translational Medicine Comparative study of Schisandra species on VCI
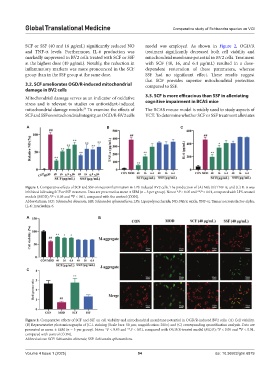
SCF or SSF (40 and 16 μg/mL) significantly reduced NO model was employed. As shown in Figure 2, OGD/R
and TNF-α levels. Furthermore, IL-6 production was treatment significantly decreased both cell viability and
markedly suppressed in BV2 cells treated with SCF or SSF mitochondrial membrane potential in BV2 cells. Treatment
at the highest dose (40 μg/mL). Notably, the reduction in with SCF (40, 16, and 6.4 μg/mL) resulted in a dose-
inflammatory markers was more pronounced in the SCF dependent restoration of these parameters, whereas
group than in the SSF group at the same dose. SSF had no significant effect. These results suggest
that SCF provides superior mitochondrial protection
3.2. SCF ameliorates OGD/R-induced mitochondrial compared to SSF.
damage in BV2 cells
Mitochondrial damage serves as an indicator of oxidative 3.3. SCF is more efficacious than SSF in alleviating
stress and is relevant to studies on antioxidant-induced cognitive impairment in BCAS mice
mitochondrial damage models. To examine the effects of The BCAS mouse model is widely used to study aspects of
24
SCF and SSF on mitochondrial integrity, an OGD/R-BV2 cells VCT. To determine whether SCF or SSF treatment alleviates
A B C
Figure 1. Comparative effects of SCF and SSF on neuroinflammation in LPS-induced BV2 cells. The production of (A) NO, (B) TNF-α, and (C) IL-6 was
inhibited following SCF or SSF treatment. Data are presented as mean ± SEM (n = 3 per group). Notes: *P < 0.05 and **P < 0.01, compared with LPS-treated
models (MOD); P < 0.05 and P < 0.01, compared with the control (CON).
#
##
Abbreviations: SCF: Schisandra chinensis; SSF: Schisandra sphenanthera; LPS: Lipopolysaccharide; NO: Nitric oxide; TNF-α: Tumor necrosis factor-alpha;
IL-6: Interleukin-6.
A B
C
Figure 2. Comparative effects of SCF and SSF on cell viability and mitochondrial membrane potential in OGD/R-induced BV2 cells. (A) Cell viability.
(B) Representative photomicrographs of JC-1 staining (Scale bars: 50 μm; magnification: 200×) and (C) corresponding quantification analysis. Data are
presented as mean ± SEM (n = 3 per group). Notes: *P < 0.05 and **P < 0.01, compared with OGD/R-treated model (MOD); P < 0.05 and P < 0.01,
#
##
compared with control (CON).
Abbreviations: SCF: Schisandra chinensis; SSF: Schisandra sphenanthera.
Volume 4 Issue 1 (2025) 94 doi: 10.36922/gtm.6879