
Page 83 - GTM-4-2
P. 83
Global Translational Medicine Angiotensinogen in liver steatosis
3.2. WD altered the liver transcriptome related to of feeding. Then, DEG analyses were performed among
inflammation consistent with the progression of all four groups. There were 5,256 DEGs, and hierarchical
steatosis clustering identified four distinct clusters in the DEGs
To identify key molecules driving WD-induced liver (Figure 2B). Cluster 1 contained DEGs that were increased
steatosis, bulk RNA-sequencing was performed in livers transiently by WD feeding at the initiation phase of liver
from LDLR -/- mice fed WD for 0, 5, 14, or 42 days. The steatosis. Meanwhile, DEGs in Cluster 2 were decreased
bulk RNA sequencing identified 31,403 genes. Principal by WD feeding. DEGs in Cluster 3 were increased
component analysis using unfiltered transcriptomes transiently by WD feeding before the initiation phase of
revealed distinct transcriptomic alterations in mice fed steatosis. Of note, Cluster 4 was composed of genes that
WD for 14 or 42 days compared to those fed WD for were increased by WD feeding concurrent with steatosis
5 days or baseline controls (Figure 2A), with the first two development. GO enrichment analysis for biological
principal components explaining 26.5% of the variance processes was then performed to characterize the DEGs
among samples (15.4% + 11.1%). These data suggest within each cluster. DEGs in Cluster 1 were associated
that WD induces a transcriptomic shift within 14 days mainly with epithelial tube morphogenesis and cell-
A B
C D
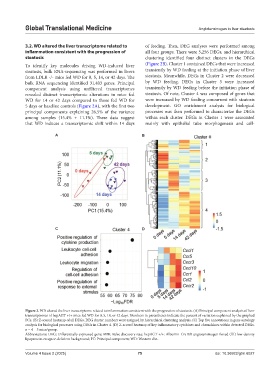
Figure 2. WD altered the liver transcriptome related to inflammation consistent with the progression of steatosis. (A) Principal component analysis of liver
transcriptomes of hepAGT +/+ mice fed WD for 0, 5, 14, or 42 days. Numbers in parentheses indicate the percent of variation explained by the graphed
PCs. (B) Z-scored heatmap of all DEGs. DEG cluster numbers were assigned by hierarchical clustering analysis. (C) Top five annotations in gene ontology
analysis for biological processes using DEGs in Cluster 4. (D) Z-scored heatmap of key inflammatory cytokines and chemokines within detected DEGs.
n = 4 – 5 mice/group.
Abbreviations: DEG: Differentially expressed gene; FDR: False discovery rate; hepAGT +/+: Albumin-Cre 0/0 angiotensinogen floxed (f/f) low-density
lipoprotein-receptor-deficient background; PC: Principal component; WD: Western diet.
Volume 4 Issue 2 (2025) 75 doi: 10.36922/gtm.6027