Page 26 - IJAMD-1-1
P. 26

International Journal of AI
            for Material and Design                                               ML in 3D bioprinting of cultivated meat


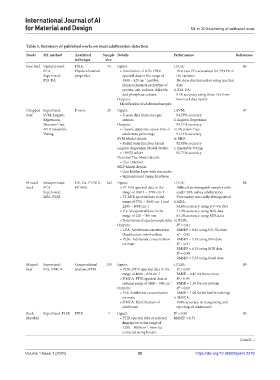
            Table 5. Summary of published works on meat adulteration detection
            Foods  ML method     Analytical   Sample  Details              Performance               References
                                 technique    size
            Raw beef Unsupervised:  FTIR,      55  Inputs:                 i. PCA:                      86
                   PCA           Physicochemical    •  Data fusion of ATR‑FTIR   First two PCs accounted for 79.93% of
                   Supervised:   properties          spectral data in the range of    the variance.
                   PLS-DA                            4000 – 525 cm  and five   No clear discrimination using spectral
                                                              -1
                                                     physicochemical properties of   data
                                                     protein, ash, sodium, chloride,   ii. PLS-DA:
                                                     and phosphate content  91% accuracy using three LVs from
                                                   Outputs:                 low-level data fusion
                                                    Identification of adulterated samples
            Chopped  Supervised:  E-nose       21  Inputs:                 i. SVM:                      87
            beef   SVM, Logistic                    •  E‑nose data from nine gas   94.57% accuracy
                   Regression,                       sensors               ii. Logistic Regression:
                   Decision Tree,                  Outputs:                 93.71% accuracy
                   MLP, Ensemble                    •  Classification into seven bins of  iii. Decision Tree:
                   Voting                            adulterant percentage  91.14% accuracy
                                                   SVM Model details:      iv. MLP:
                                                    • Radial basis function kernel  92.85% accuracy
                                                   Logistic Regression Model details:  v. Ensemble Voting:
                                                    • LBFGS solver          95.71% accuracy
                                                   Decision Tree Model details:
                                                    • Gini criterion
                                                   MLP Model details:
                                                    • One hidden layer with ten nodes
                                                    • Sigmoidal and tansig functions
            Minced   Unsupervised:  UV-Vis, FT-NIR,   242  Inputs:         i. PCA:                      88
            Beef   PCA           FT-MIR             •  FT‑NIR spectral data in the   Difficult to distinguish samples with
                   Supervised:                       range of 10614 – 3749 cm-1  under 20% turkey adulteration
                   LDA, PLSR                        •  FT‑MIR spectral data in the   Pure turkey was easily distinguished
                                                     range of 3701 – 2642 cm-1 and   ii. LDA:
                                                     2295 – 1008 cm-1       54.6% accuracy using UV-Vis data
                                                    •  UV‑Vis spectral data in the   71.2% accuracy using NIR data
                                                     range of 220 – 700 nm  65.2% accuracy using MIR data
                                                    • Data fusion of spectroscopic data iii. PLSR:
                                                   Outputs:                 R  = 0.81
                                                                             2
                                                    •  LDA: Adulterant concentration   RMSEP = 8.61 using UV-Vis data
                                                     classification into five bins  R  = 0.92
                                                                             2
                                                    •  PLSR: Adulterant concentration   RMSEP = 5.79 using NIR data
                                                     estimate               R  = 0.91
                                                                             2
                                                                            RMSEP = 6.19 using MIR data
                                                                            R  = 0.95
                                                                             2
                                                                            RMSEP = 5.33 using fused data
            Minced   Supervised:  Compositional   135  Inputs:             i. PLSR:                     89
            beef   PLS, SIMCA    analysis, FTIR     •  PLSR: FTIR spectral data in the   R  > 0.99
                                                                             2
                                                     range of 4000 – 650 cm-1  RMSE = 0.45 for horse meat
                                                                             2
                                                    •  SIMCA: FTIR spectral data at   R > 0.99
                                                     optimal range of 1800 – 900 cm -1  RMSE = 1.39 for soy protein
                                                                             2
                                                   Outputs:                 R  > 0.99
                                                    •  PLS: Adulterant concentration   RMSE = 1.00 for fat beef trimmings
                                                     estimate              ii. SIMCA:
                                                    •  SIMCA: Identification of   100% accuracy in recognizing and
                                                     adulterant             rejecting all adulterants
            Beef,   Supervised: PLSR  FTIR     7   Inputs:                 R  > 0.99                    90
                                                                            2
            Meatball                                •  FTIR spectral data at selected   RMSEP = 0.71
                                                     fingerprint in the range of
                                                     1200 – 1000 cm , from fat
                                                               -1
                                                     extracted using hexane
                                                                                                       (Cont’d...)
            Volume 1 Issue 1 (2024)                         20                      https://doi.org/10.36922/ijamd.2279
   21   22   23   24   25   26   27   28   29   30   31