
Page 21 - IJAMD-1-1
P. 21
International Journal of AI
for Material and Design ML in 3D bioprinting of cultivated meat
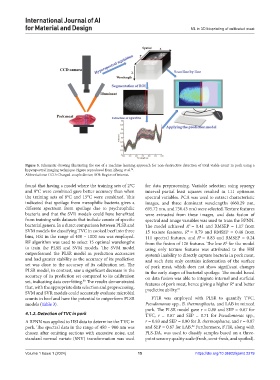
Figure 5. Schematic drawing illustrating the use of a machine learning approach for non-destructive detection of total viable count in pork using a
74
hyperspectral imaging technique. Figure reproduced from Zheng et al. .
Abbreviations: CCD: Charged-couple device; ROI: Region of interest.
found that having a model where the training sets of 2°C for data preprocessing. Variable selection using synergy
and 8°C were combined gave better accuracy than when interval partial least squares resulted in 111 optimum
the training sets of 8°C and 15°C were combined. This spectral variables. PCA was used to extract characteristic
indicated that spoilage from mesophilic bacteria gives a images, and three dominant wavelengths (660.29 nm,
different spectrum from spoilage due to psychrophilic 695.72 nm, and 730.43 nm) were selected. Texture features
bacteria and that the SVR models could have benefitted were extracted from these images, and data fusion of
from training with datasets that include counts of specific spectral and image variables was used to train the BPNN.
bacterial genera. In a direct comparison between PLSR and The model achieved R = 0.41 and RMSEP = 1.17 from
2
SVM models for classifying TVC in cooked beef into three 15 texture features, R = 0.79 and RMSEP = 0.46 from
2
bins, HSI in the range of 400 – 1000 nm was employed. 111 spectral features, and R = 0.83 and RMSEP = 0.24
2
RF algorithm was used to select 15 optimal wavelengths from the fusion of 126 features. The low R for the model
2
to train the PLSR and SVM models. The SVM model using only texture features was attributed to the HSI
outperformed the PLSR model in prediction accuracies system’s inability to directly capture bacteria in pork meat,
and had greater stability as the accuracy of its prediction and such data only contains information of the surface
set was close to the accuracy of its calibration set. The of pork meat, which does not show significant changes
PLSR model, in contrast, saw a significant decrease in the in the early stages of bacterial spoilage. The model based
accuracy of its prediction set compared to its calibration on data fusion was able to integrate internal and surficial
set, indicating data overfitting. The results demonstrated features of pork meat, hence giving a higher R and better
80
2
that, with the appropriate data selection and preprocessing, predictive ability. 81
SVM and SVR models could accurately evaluate microbial
counts in beef and have the potential to outperform PLSR FTIR was employed with PLSR to quantify TVC,
models (Table 3). Pseudomonas spp., B. thermosphacta, and LAB in minced
pork. The PLSR model gave r = 0.88 and SEP = 0.67 for
4.1.2. Detection of TVC in pork TVC, r = 0.87 and SEP = 0.71 for Pseudomonas spp.,
A BPNN was applied to HSI data to determine the TVC in r = 0.83 and SEP = 0.80 for B. thermosphacta, and r = 0.87
pork. The spectral data in the range of 450 – 900 nm was and SEP = 0.67 for LAB. Furthermore, FTIR, along with
82
chosen after omitting sections with excessive noise, and PLS-DA, was used to classify samples based on a three-
standard normal variate (SNV) transformation was used point sensory quality scale (fresh, semi-fresh, and spoiled).
Volume 1 Issue 1 (2024) 15 https://doi.org/10.36922/ijamd.2279