
Page 19 - IJAMD-1-1
P. 19
International Journal of AI
for Material and Design ML in 3D bioprinting of cultivated meat
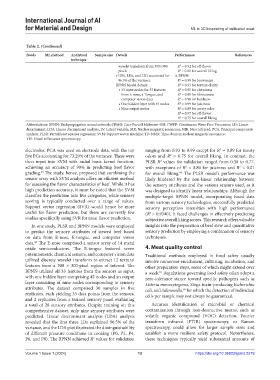
Table 2. (Continued)
Foods ML method Analytical Sample size Details Performance References
technique
• wavelet transform from 300×300 R = 0.52 for off-flavor
2
pixels R < 0.01 for overall liking
2
• LD1, LD2, and LD3 accounted for ii. BPNN:
96.5% of the variance R = 0.99 for brownness
2
BPNN Model details: R = 0.93 for texture clarity
2
• 33 input nodes for 33 features R = 0.95 for chewiness
2
from E-nose, e-Tongue, and R = 0.99 for fibrousness
2
computer vision data R = 0.98 for hardness
2
• One hidden layer with 45 nodes R = 0.99 for juiciness
2
• Nine output nodes R = 0.89 for meaty odor
2
R = 0.97 for off-flavor
2
R = 0.75 for overall liking
2
Abbreviations: BPNN: Backpropagation neural network; CPMG: Carr-Purcell Meiboom-Gill; CWFP: Continuous Wave-Free Precession; LD: Linear
discriminant; LDA: Linear discriminant analysis; LV: Latent variable; MR: Nuclear magnetic resonance; NIR: Near infrared; PCA: Principal component
analysis; PLSR: Partial least squares regression; SVM: Support vector machine; TD-NMR: Time-domain nuclear magnetic resonance;
VIS: Visual reflectance spectroscopy.
electrodes. PCA was used on electrode data, with the top ranging from 0.93 to 0.99 except for R = 0.89 for meaty
2
five PCs accounting for 73.29% of the variance. These were odors and R = 0.75 for overall liking. In contrast, the
2
then input into SVM with radial basis kernel function, PLSR R values for validation ranged from 0.30 to 0.77,
2
achieving an accuracy of 90% in predicting beef flavor with exceptions of R = 0.80 for juiciness and R < 0.01
2
2
65
grading. The study, hence, proposed that combining the for overall liking. The PLSR model’s performance was
66
sensor array with SVM analysis offers an efficient method likely hindered by the non-linear relationship between
for assessing the flavor characteristics of beef. While it has the sensory attributes and the various sensors used, as it
high prediction accuracy, it must be noted that the SVM was designed to identify linear relationships. Although the
classifies the prediction into five categories, while sensory multiple-target BPNN model, incorporating fused data
scoring is typically conducted over a range of values. from various sensory technologies, successfully predicted
Support vector regression (SVR) would hence be more sensory perception intensities with high performance
useful for flavor prediction, but there are currently few (R > 0.9340), it faced challenges in effectively predicting
2
studies specifically using SVR for meat flavor prediction. subjective overall liking scores. This research offers valuable
In one study, PLSR and BPNN models were employed insights into the preparation of beef stew and quantitative
to predict the sensory attributes of stewed beef based sensory prediction by employing a combination of sensory
on data from E-nose, E-tongue, and computer vision techniques.
66
data. The E-nose comprised a sensor array of 14 metal
oxide semiconductors. The E-tongue featured seven 4. Meat quality control
potentiometric chemical sensors, and computer vision data Traditional methods employed in food safety usually
utilized discrete wavelet transform to extract 12 textural involve numerous enrichment, culturing, incubation, and
features from a 300 × 300-pixel region of interest. The other preparation steps, some of which might extend over
BPNN utilized all 33 features from the sensors as input, a week. Regulations governing food safety often adopt a
67
with one hidden layer comprising 45 nodes and an output zero-tolerance stance toward specific pathogens such as
layer consisting of nine nodes corresponding to sensory Listeria monocytogenes, Shiga toxin-producing Escherichia
attributes. The dataset comprised 30 samples in five coli, and Salmonella, for which the detection of individual
68
replicates, each yielding 33 data points from the sensors, cells per sample may not always be guaranteed.
and 2 replicates from a trained sensory panel evaluating
a total of 28 sensory attributes. Despite training on this Accurate identification of microbial or chemical
comprehensive dataset, only nine sensory attributes were contamination through non-destructive means, such as
predicted. Linear discriminant analysis (LDA) analysis volatile organic compound (VOC) detection, Fourier
revealed that the first three LDs explained 96.5% of the transform infrared (FTIR) spectroscopy, or Raman
variance, and the LDA plot illustrated the distinguishability spectroscopy, could allow for larger sample sizes and
of different pressure conditions in cooking (P0, P2, P4, establish a more resilient safety protocol. Nevertheless,
P6, and P8). The BPNN achieved R values for validation these techniques typically yield substantial amounts of
2
Volume 1 Issue 1 (2024) 13 https://doi.org/10.36922/ijamd.2279