
Page 22 - IJAMD-1-1
P. 22
International Journal of AI
for Material and Design ML in 3D bioprinting of cultivated meat
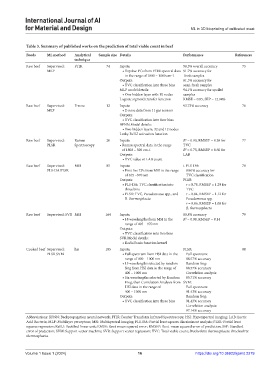
Table 3. Summary of published works on the prediction of total viable count in beef
Foods ML method Analytical Sample size Details Performance References
technique
Raw beef Supervised: FTIR 74 Inputs: 90.5% overall accuracy 75
MLP • Top five PCs from FTIR spectral data 91.7% accuracy for
in the range of 1800 – 1000 cm-1 fresh samples
Outputs: 81.3% accuracy for
• TVC classification into three bins semi-fresh samples
MLP model details: 94.1% accuracy for spoiled
• One hidden layer with 10 nodes samples
Logistic sigmoid transfer function RMSE = 0.85, SEP = 12.94%
Raw beef Supervised: E-nose 12 Inputs: 93.73% accuracy 76
MLP • E‑nose data from 11 gas sensors
Outputs:
• TVC classification into four bins
BPNN Model details:
• Two hidden layers, 32 and 12 nodes
Leaky ReLU activation function
Raw beef Supervised: Raman 20 Inputs: R = 0.90, RMSEP = 0.38 for 77
2
PLSR Spectroscopy • Raman spectral data in the range TVC
of 1800 – 500 cm-1 R = 0.75, RMSEP = 0.60 for
2
Outputs: LAB
• TVC value or LAB count
Raw beef Supervised: MSI 85 Inputs: i. PLS-DA: 78
PLS-DA PLSR • First five LVs from MSI in the range 80.0% accuracy for
of 405 –970 nm TVC classification
Outputs: PLSR:
• PLS‑DA: TVC classification into r = 0.78, RMSEP = 1.29 for
three bins TVC
• PLSR: TVC, Pseudomonas spp., and r = 0.84, RMSEP = 1.12 for
B. thermosphacta Pseudomonas spp.
r = 0.86, RMSEP = 1.00 for
B. thermosphacta
Raw beef Supervised: SVR MSI 164 Inputs: 80.8% accuracy 79
2
• 18 wavelengths from MSI in the R = 0.98, RMSEP = 0.14
range of 405 – 970 nm
Outputs:
• TVC classification into two bins
SVR Model details:
• Radial basis function kernel
Cooked beef Supervised: his 105 Inputs: PLSR: 80
PLSR SVM • Full spectrum from HSI data in the Full spectrum:
range of 400 – 1000 nm 88.57% accuracy
• 15 wavelengths selected by random Random frog:
frog from HSI data in the range of 88.57% accuracy
400 – 1000 nm Correlation analysis:
• Six wavelengths selected by Random 85.71% accuracy
Frog, then Correlation Analysis from SVM:
HSI data in the range of Full spectrum:
400 – 1000 nm 91.43% accuracy
Outputs: Random frog:
• TVC classification into three bins 91.43% accuracy
Correlation analysis:
97.14% accuracy
Abbreviations: BPNN: Backpropagation neural network; FTIR: Fourier Transform Infrared Spectroscopy; HSI: Hyperspectral imaging; LAB: Lactic
Acid Bacteria; MLP: Multilayer perceptron; MSI: Multispectral imaging; PLS-DA: Partial least squares discriminant analysis; PLSR: Partial least
squares regression; ReLU: Rectified linear unit; RMSE: Root-mean squared error; RMSEP: Root-mean squared error of prediction; SEP: Standard
error of prediction; SVM: Support vector machine; SVR: Support vector regression; TVC: Total viable count; Brochothrix thermosphacta: Brochothrix
thermosphacta.
Volume 1 Issue 1 (2024) 16 https://doi.org/10.36922/ijamd.2279