Page 24 - IJAMD-1-1
P. 24

International Journal of AI
            for Material and Design                                               ML in 3D bioprinting of cultivated meat


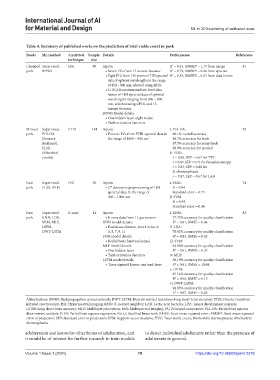
            Table 4. Summary of published works on the prediction of total viable count in pork
            Foods  ML method  Analytical  Sample  Details                Performance                 References
                              technique  size
            Chopped  Supervised:   HSI  90   Inputs:                     R  = 0.41, RMSEP = 1.17 from image  81
                                                                          2
            pork   BPNN                       • Seven PCs from 15 texture features  R  = 0.79, RMSEP = 0.46 from spectra
                                                                          2
                                              •  Eight PCs from 111 points of HSI spectral  R  = 0.83, RMSEP = 0.24 from data fusion
                                                                          2
                                               data of optimal wavelengths in the range
                                               of 450 – 900 nm, selected using siPLS.
                                              •  11 PCs from intermediate‑level data
                                               fusion of HSI spectral data of optimal
                                               wavelengths ranging from 450 – 900
                                               nm, selected using siPLS, and 15
                                               texture features.
                                             BPNN Model details:
                                              • One hidden layer, eight nodes
                                              • Tanh activation function
            Minced  Supervised:   FTIR  134  Inputs:                     i. PLS-DA:                     82
            pork   PLS-DA                     •  First six LVs from FTIR spectral data in   88.1% overall accuracy
                   (Sensory                    the range of 1800 – 900 cm -1  86.7% accuracy for fresh
                   freshness),                                            87.5% accuracy for semi-fresh
                   PLSR                                                   88.9% accuracy for spoiled
                   (Microbial                                            ii. PLSR:
                   counts)                                                r = 0.88, SEP = 0.67 for TVC
                                                                          r = 0.87, SEP = 0.71 for Pseudomonas spp.
                                                                          r = 0.83, SEP = 0.80 for
                                                                          B. thermosphacta
                                                                          r = 0.87, SEP = 0.67 for LAB
            Raw    Supervised:  HSI     50   Inputs:                     i. PLSR:                       74
            pork   PLSR, SVM                  •  2  derivative preprocessing of HSI   R = 0.94
                                                nd
                                               spectral data in the range of    Standard error = 0.74
                                               400 – 1000 nm             ii. SVM:
                                                                          R = 0.94
                                                                          Standard error = 0.46
            Raw    Supervised:  E-nose  12   Inputs:                     i. KNN:                        83
            pork   KNN, LDA,                  • E‑nose data from 11 gas sensors  77.73% accuracy for quality classification
                                                                           2
                   SVM, MLP,                 KNN model details:           R  = 0.81, RMSE = 0.46
                   LSTM,                      •  Euclidean distance, best k value in    ii. LDA:
                   DWT-LSTM                    3, 5, 7, 9, 11             76.82% accuracy for quality classification
                                             SVM model details:           R  = 0.83, RMSE = 0.42
                                                                           2
                                              • Radial basis function kernel  iii. SVM:
                                             MLP model details:           84.88% accuracy for quality classification
                                                                           2
                                              • One hidden layer          R  = 0.91, RMSE = 0.37
                                              • Tanh activation function  iv. MLP:
                                             LSTM model details:          56.19% accuracy for quality classification
                                              • Three sigmoid layers, one tanh layer  R  = 0.41, RMSE = 10.64
                                                                           2
                                                                         v. LSTM:
                                                                          85.14% accuracy for quality classification
                                                                          R  = 0.96, RMSE = 0.15
                                                                           2
                                                                         vi. DWT-LSTM:
                                                                          94.83% accuracy for quality classification
                                                                           2
                                                                          R  = 0.97, RMSE = 0.05
            Abbreviations: BPNN: Backpropagation neural network; DWT-LSTM: Discrete wavelet transform-long short-term memory; FTIR: Fourier transform
            infrared spectroscopy; HSI: Hyperspectral imaging; KNN: K-nearest neighbor; LAB: Lactic acid bacteria; LDA: Linear discriminant analysis;
            LSTM: Long short-term memory; MLP: Multilayer perceptron; MSI: Multispectral imaging; PC: Principal component; PLS-DA: Partial least squares
            discriminant analysis; PLSR: Partial least squares regression; ReLU: Rectified linear unit; RMSE: Root-mean squared error; RMSEP: Root-mean squared
            error of prediction; SEP: Standard error of prediction; SVM: Support vector machine; TVC: Total viable count; Brochothrix thermosphacta: Brochothrix
            thermosphacta.

            adulteration and less so for other forms of adulteration, and   to detect individual adulterants rather than the presence of
            it would be of interest for further research to train models   adulterants in general.


            Volume 1 Issue 1 (2024)                         18                      https://doi.org/10.36922/ijamd.2279
   19   20   21   22   23   24   25   26   27   28   29