
Page 18 - IJAMD-1-1
P. 18
International Journal of AI
for Material and Design ML in 3D bioprinting of cultivated meat
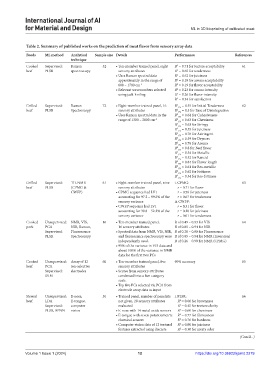
Table 2. Summary of published works on the prediction of meat flavor from sensory array data
Foods ML method Analytical Sample size Details Performance References
technique
Cooked Supervised: Raman 52 • Ten‑member trained panel, eight R = 0.71 for texture acceptability 61
2
beef PLSR spectroscopy sensory attributes R = 0.65 for tenderness
2
• Uses Raman spectral data R = 0.62 for juiciness
2
approximately in the range of R = 0.18 for aroma acceptability
2
600 – 1700 cm -1 R = 0.19 for flavor acceptability
2
• Relevant wavenumbers selected R = 0.23 for aroma intensity
2
using jack-knifing R = 0.26 for flavor intensity
2
R = 0.34 for satisfaction
2
Grilled Supervised: Raman 72 • Eight‑member trained panel, 16 R 2 CV = 0.55 for Initial Tenderness 62
beef PLSR Spectroscopy sensory attributes R 2 CV = 0.5 for Ease of Disintegration
• Uses Raman spectral data in the R 2 CV = 0.64 for Cohesiveness
range of 1300 – 2800 cm -1 R 2 CV = 0.63 for Chewiness
R 2 CV = 0.63 for Stringy
R 2 CV = 0.55 for Juiciness
R 2 CV = 0.76 for Astringent
R 2 CV = 0.59 for Dryness
R 2 CV = 0.76 for Aroma
R 2 CV = 0.8 for Beef flavor
R 2 CV = 0.54 for Metallic
R 2 CV = 0.52 for Rancid
R 2 CV = 0.84 for Flavor length
R 2 CV = 0.61 for Res-metallic
R 2 CV = 0.62 for Fattiness
R 2 = 0.54 for Res-fattiness
CV
Grilled Supervised: TD-NMR 61 • Eight‑member trained panel, nine i. CPMG: 63
beef PLSR (CPMG & sensory attributes r = 0.71 for flavor
CWFP) • CPMG sequence had LV1 r = 0.56 for juiciness
accounting for 97.2 – 99.2% of the r = 0.67 for tenderness
sensory variance ii. CWFP:
• CWFP sequence had LV1 r = 0.31 for flavor
accounting for 39.8 – 52.2% of the r = 0.28 for juiciness
sensory variance r = 0.01 for tenderness
Cooked Unsupervised: NMR, VIS, 16 • Ten‑member trained panel, R of 0.49 – 0.93 for VIS 64
pork PCA NIR, Raman, 16 sensory attributes R of 0.05 – 0.94 for NIR
Supervised: Fluorescence • Spectral data from NMR, VIS, NIR, R of 0.26 – 0.80 for Fluorescence
PLSR Spectroscopy and fluorescence spectroscopy were R of 0.05 – 0.94 for NMR (Inversion)
independently used. R of 0.26 – 0.90 for NMR (CPMG)
• 95% of the variance in VIS data and
about 100% of the variance in NMR
data for the first two PCs
Cooked Unsupervised: Array of 12 60 • Ten‑member trained panel, five 90% accuracy 65
beef PCA ion-selective sensory attributes
Supervised: electrodes • Scores from sensory attributes
SVM condensed into a five-category
scale.
• Top five PCs selected via PCA from
electrode array data as input
Stewed Unsupervised: E-nose, 30 • Trained panel, number of panelists i. PLSR: 66
beef LDA E-tongue, not given, 28 sensory attributes R = 0.66 for brownness
2
Supervised: computer evaluated R = 0.45 for texture clarity
2
PLSR, BPNN vision • E‑nose with 14 metal oxide sensors R = 0.60 for chewiness
2
• E‑tongue with seven potentiometric R = 0.77 for fibrousness
2
chemical sensors R = 0.76 for hardness
2
• Computer vision data of 12 textural R = 0.80 for juiciness
2
features extracted using discrete R = 0.30 for meaty odor
2
(Cont’d...)
Volume 1 Issue 1 (2024) 12 https://doi.org/10.36922/ijamd.2279