
Page 16 - IJAMD-1-1
P. 16
International Journal of AI
for Material and Design ML in 3D bioprinting of cultivated meat
gas chromatography-mass spectroscopy (GC-MS), using Another study evaluated the use of an artificial neural
gas chromatography-olfactometry (GC-O) to acquire network (ANN) to predict the resultant flavor of beef
more detailed sensory characteristics of each compound tallow after undergoing hydrolysis and Maillard reaction,
and screen out non-odor-active compounds and finally, comparing a single input single output (SISO) model that
building partial least squares regression (PLSR) models to only considers the relationship between flavor compounds
correlate the data to that acquired from a sensory panel. 57-59 and sensory scores, and a multiple input single output
The first two principal components (PCs) often account for (MISO) model that included the interactions and masking
a significant portion of the variance in sensory evaluation effects between flavor compounds. The models took
60
attributed to molecular composition. However, individual the concentration of each of the 47 volatile compounds
compounds tend to contribute only modestly to sensory identified through GC × GC-MS as the input, feeding into
perception. The application of ML in these studies was, an input layer with a rectified linear unit (ReLU) activation
hence, useful for their ability to identify the cumulative function. The models included a multiple-model layer
effect of many small changes in composition on the overall with two regimes to limit the output to a maximum and
perceived flavor (Table 1). minimum reasonable value, which were then weighted and
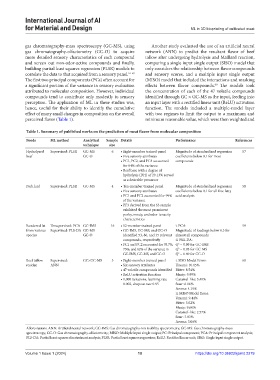
Table 1. Summary of published works on the prediction of meat flavor from molecular composition
Foods ML method Analytical Sample Details Performance References
technique size
Hydrolyzed Supervised: PLSR GC-MS 6 • Eight‑member trained panel Magnitude of standardized regression 57
beef GC-O • Five sensory attributes coefficients below 0.1 for most
• PC1, PC2, and PC3 accounted compounds
for 84% of the variance
• Beef base with a degree of
hydrolysis (DH) of 29.13% served
as a desirable precursor
Pork lard Supervised: PLSR GC-MS 4 • Ten‑member trained panel Magnitude of standardized regression 58
• Five sensory attributes coefficients below 0.1 for all free fatty
• PC1 and PC2 accounted for 99% acid analysis
of the variance
• PF3 derived from the S3 sample
exhibited the most prominent
porky, meaty, and odor-tenacity
characteristics
Rendered fat Unsupervised: PCA GC-IMS 16 • 12‑member trained panel i. PCA: 59
from various Supervised: PLS-DA GC-MS • GC‑IMS, GC‑MS, and GC‑O Magnitude of loadings below 0.3 for
species GC-O identified 53, 86, and 35 relevant almost all compounds
compounds, respectively ii. PLS-DA:
• PC1 and PC2 accounted for 79.7%, Q = 0.99 for GC-IMS
2
75%, and 62% of the variance in Q = 0.95 for GC-MS
2
GC-IMS, GC-MS, and GC-O Q = 0.89 for GC-O
2
Beef tallow Supervised: GC×GC-MS 5 • Eight‑member trained panel i. SISO Model Error: 60
residue ANN • Six sensory attributes Umami: 10.15%
• 47 volatile compounds identified Bitter: 8.54%
• ReLU activation function Meaty: 9.89%
• 1,000 iterations, learning rate Caramel-like: 3.49%
0.002, dropout rate 0.95 Sour: 6.06%
Aroma: 4.19%
ii. MISO Model Error:
Umami: 9.44%
Bitter: 5.02%
Meaty: 9.60%
Caramel-like: 2.57%
Sour: 7.83%
Aroma: 3.06%
Abbreviations: ANN: Artificial neural network; GC-IMS: Gas chromatography-ion mobility spectrometry; GC-MS: Gas chromatography-mass
spectroscopy; GC-O: Gas chromatography-olfactometry; MISO: Multiple input single output; PC: Principal component; PCA: Principal component analysis;
PLS-DA: Partial least squares discriminant analysis; PLSR: Partial least squares regression; ReLU: Rectified linear unit; SISO: Single input single output.
Volume 1 Issue 1 (2024) 10 https://doi.org/10.36922/ijamd.2279