
Page 42 - IJAMD-1-1
P. 42
International Journal of AI
for Material and Design ML for quality improvement in L-PBF
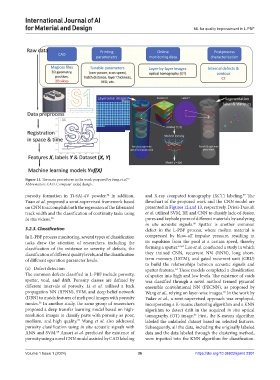
Figure 11. The main procedures in the work proposed by Feng et al. 53
Abbreviation: CAD: Computer-aided design.
porosity formation in Ti-6Al-4V powder. In addition, and X-ray computed tomography (XCT) labeling. The
59
54
Yuan et al. proposed a semi-supervised framework based flowchart of the proposed work and the CNN model are
on CNN to accomplish both the regression of the fabricated presented in Figures 12 and 13, respectively. Drissi-Daoudi
track width and the classification of continuity tasks using et al. utilized SVM, RF, and CNN to classify lack-of-fusion
in situ videos. 55 pores and keyhole pores of different materials by analyzing
in situ acoustic signals. Spatter is another common
60
3.2.3. Classification defect in the L-PBF process, where molten material is
In L-PBF process monitoring, several types of classification compressed by blow-off impulse pressure, resulting in
tasks draw the attention of researchers, including the its expulsion from the pool at a certain speed, thereby
classification of the existence or severity of defects, the forming a spatter. 61,62 Luo et al. conducted a study in which
classification of different quality levels, and the classification they trained CNN, recurrent NN (RNN), long short-
of different operation parameter levels. term memory (LSTM), and gated recurrent unit (GRU)
to build the relationships between acoustic signals and
(a) Defect detection spatter features. These models completed a classification
63
The common defects classified in L-PBF include porosity, of spatter into high and low levels. The existence of voids
spatter, void, and drift. Porosity classes are defined by was classified through a novel method termed pyramid
different intervals of porosity. Li et al. utilized a back ensemble convolutional NN (PECNN), as proposed by
propagation NN (BPNN), SVM, and deep belief network Wang et al., relying on layer-wise images. In the work by
64
(DBN) to match features of melt pool images with porosity Yadav et al., a semi-supervised approach was employed,
modes. In another study, the same group of researchers incorporating a K-means clustering algorithm and a KNN
56
proposed a deep transfer learning model based on high- algorithm to detect drift in the acquired in situ optical
resolution images to classify parts with porosity as poor, tomography (OT) image. First, the K-means algorithm
65
57
medium, and high quality. Wang et al. also addressed labeled the unlabeled dataset based on selected features.
porosity classification using in situ acoustic signals with Subsequently, all the data, including the originally labeled
ANN and SVM. Ansari et al. predicted the existence of data and the data labeled through the clustering method,
58
porosity using a novel CNN model assisted by CAD labeling were inputted into the KNN algorithm for classification.
Volume 1 Issue 1 (2024) 36 https://doi.org/10.36922/ijamd.2301