
Page 55 - IJAMD-1-1
P. 55
International Journal of AI
for Material and Design Integrating physics data for DL in DED
Subsequently, a total of 625 datasets were augmented correlated with LP and sulfur content and negatively with
through simulation data, forming the basis for pre-training SS and PMFR. “b2” demonstrated a negative correlation
the deep learning model. The output dataset consists of with LP and sulfur content while correlating positively
three coefficients representing the polynomial curve for with SS and PMFR.
deposition shape and three coefficients representing the In the augmented experiment data presented in
dilution polynomial curve. Figure 8, distinct correlations were observed. The bead
2.3.2. Statistical analysis of data coefficient “a0” exhibited a negative correlation with LP
and PMFR while showing a positive correlation with SS.
In ML, the quality of the dataset significantly influences the Meanwhile, the bead coefficient “a1” demonstrated negative
performance of the ML model. Therefore, various datasets, correlations with LP, SS, and PMFR. On the other hand,
including augmented simulation, augmented experiment, the bead coefficient “a2” displayed positive correlations
simulation, and experimental, must be subjected to with LP and PMFR. Turning to the dilution coefficients,
correlation and outlier analysis to assess data quality before both “b0” and “b1” exhibited weak negative correlations
using it in training and testing. with LP and strong negative correlations with PMFR. The
Analyzing the augmented simulation data (Figure 7) dilution coefficient “b2” displayed a weak correlation with
revealed specific correlations. The bead coefficient “a0” LP and a strong correlation with SS.
exhibited a positive correlation with LP and a negative In the simulation data (Figure 9), “a0” exhibited a
correlation with SS and sulfur content. Given the symmetric positive correlation with LP and a negative correlation
curves used to describe the melt track under ideal conditions with sulfur content and SS. Similarly, “a2” demonstrated a
in both augmented simulation and simulation datasets, positive correlation with PMFR and a negative correlation
the bead coefficients “a1” and “b1” were not subjected with SS. The dilution coefficient “b0” displayed positive
to correlation analysis. The coefficient “a2” displayed a correlations with LP and sulfur content while correlating
positive correlation with PMFR and a negative correlation negatively with SS and PMFR. Conversely, “b2” exhibited
with SS. Meanwhile, the dilution coefficient “b0” positively a negative correlation with LP and a positive correlation
with SS and PMFR.
Table 1. Input parameters and output data collected from
numerical simulation for the study of sulfur variation In the experimental data (Figure 10), “a0” displayed
a positive correlation with SS and a negative correlation
Input parameters Levels Output with PMFR. In addition, “a2” demonstrated a positive
LP (W) 1400 1600 1800 Melt pool contour correlation with PMFR and a negative correlation with
PMFR (g/min) 16 18 20 coordinates in (X, Y, Z) SS. Examining the dilution coefficients, “b0” displayed a
as shown in Figure 3 positive correlation with LP, while “b2” exhibited a negative
SS (mm/min) 2000 2500 3000
Sulfur content (wt%) 0.0005 0.004 0.015 correlation with LP and a positive correlation with SS.
Abbreviations: LP: Laser power, PMFR: Powder mass flow rate, In summary, the correlation patterns observed among
SS: Scanning speed. the coefficients and factors such as LP, SS, sulfur content,
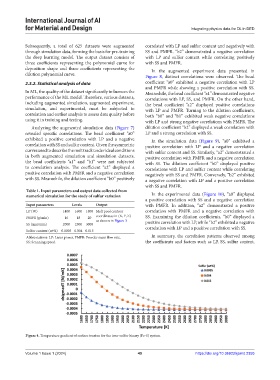
Figure 4. Temperature gradient of surface tension for the iron-sulfur binary (Fe-S) system.
Volume 1 Issue 1 (2024) 49 https://doi.org/10.36922/ijamd.2355