
Page 56 - IJAMD-1-1
P. 56
International Journal of AI
for Material and Design Integrating physics data for DL in DED
Table 2. Design matrix of the central composite design Table 4. Design matrix of full factorial design outside the
central composite design range
Run no. LP (W) PMFR (g/min) SS (mm/min)
1 1600 18 1600 Run no. LP (W) PMFR (g/min) SS (mm/min)
2 1000 18 1000 1 700 10 700
3 1300 16 1300 2 700 22 700
4 1300 16 1300 3 700 10 1900
5 1000 14 1600 4 1900 10 1900
6 1600 14 1000 5 1900 10 700
7 1600 14 1600 6 1900 22 700
8 1300 16 1300 7 1900 22 1900
9 1000 18 1600 8 700 22 1900
10 1600 18 1000 Abbreviations: LP: Laser power, PMFR: Powder mass flow rate,
11 1000 14 1000 SS: Scanning speed.
12 1300 16 1300
13 1300 16 1300
14 810 16 1300
15 1300 19 1300
16 1300 13 1300
17 1790 16 1300
18 1300 16 1300
19 1300 16 1790
20 1300 16 810
Abbreviations: LP: Laser power, PMFR: Powder mass flow rate,
SS: Scanning speed.
Table 3. Full factorial design within the central composite
design range
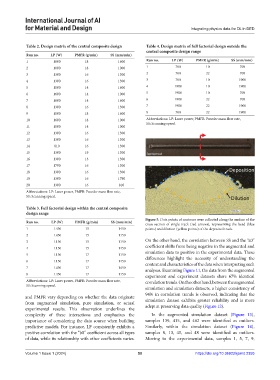
Figure 5. Data points of contours were collected along the surface of the
Run no. LP (W) PMFR (g/min) SS (mm/min) cross-section of single track (red arrows), representing the bead (blue
1 1450 15 1450 points) and dilution (yellow points) of the deposited track.
2 1450 15 1150
3 1150 15 1150 On the other hand, the correlation between SS and the “a0”
4 1150 15 1450 coefficient shifts from being negative in the augmented and
simulation data to positive in the experimental data. These
5 1150 17 1150 differences highlight the necessity of understanding the
6 1150 17 1450 context and characteristics of the data when interpreting such
7 1450 17 1450 analyses. Examining Figure 11, the data from the augmented
8 1450 17 1150
experiment and experiment datasets share 67% identical
Abbreviations: LP: Laser power, PMFR: Powder mass flow rate, correlation trends. On the other hand, between the augmented
SS: Scanning speed.
simulation and simulation datasets, a higher consistency of
94% in correlation trends is observed, indicating that the
and PMFR vary depending on whether the data originate simulation dataset exhibits greater reliability and is more
from augmented simulation, pure simulation, or actual
experimental results. This observation underlines the adept at preserving data quality (Figure 12).
complexity of these interactions and emphasizes the In the augmented simulation dataset (Figure 13),
importance of considering the data source when building samples 139, 415, and 462 were identified as outliers.
predictive models. For instance, LP consistently exhibits a Similarly, within the simulation dataset (Figure 14),
positive correlation with the “b0” coefficient across all types samples 8, 13, 45, and 48 were identified as outliers.
of data, while its relationship with other coefficients varies. Moving to the experimental data, samples 1, 5, 7, 9,
Volume 1 Issue 1 (2024) 50 https://doi.org/10.36922/ijamd.2355