
Page 60 - IJAMD-1-1
P. 60
International Journal of AI
for Material and Design Integrating physics data for DL in DED
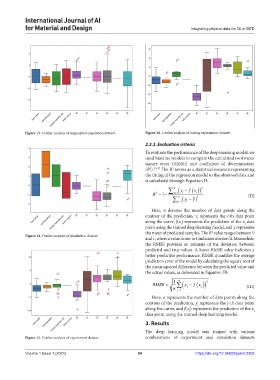
Figure 13. Outlier analysis of augmented simulation dataset. Figure 16. Outlier analysis of testing experiment dataset.
2.3.3. Evaluation criteria
To evaluate the performance of the deep learning model, we
used baseline models to compare the calculated root mean
square error (RMSE) and coefficient of determination
(R ). The R serves as a statistical measure representing
2 33-37
2
the fitting of the regression model to the observed data and
is calculated through Equation II:
( ))
∑ n ( y − fx 2
R = 1− i= 1 i i (II)
2
∑ n i= 1 ( y − ) y 2
i
Here, n denotes the number of data points along the
contour of the prediction, y represents the i-th data point
i
along the curve, f(x) represents the prediction of the x data
i
i
point using the trained deep learning model, and ȳ represents
the mean of predicted samples. The R value ranges between 0
2
Figure 14. Outlier analysis of simulation dataset.
and 1, where a value closer to 1 indicates a better fit. Meanwhile,
the RMSE provides an estimate of the deviation between
predicted and true values. A lower RMSE value indicates a
better predictive performance. RMSE quantifies the average
prediction error of the model by calculating the square root of
the mean squared difference between the predicted value and
the actual values, as delineated in Equation III:
1 n 2
( ))
RMSE = ∑ ( y − f x (III)
n j= 1 j j
Here, n represents the number of data points along the
contour of the prediction, y represents the j-th data point
j
along the curve, and f(x ) represents the prediction of the x j
i
data point using the trained deep learning model.
3. Results
The deep learning model was trained with various
Figure 15. Outlier analysis of experiment dataset. combinations of experiment and simulation datasets
Volume 1 Issue 1 (2024) 54 https://doi.org/10.36922/ijamd.2355