
Page 64 - IJAMD-1-1
P. 64
International Journal of AI
for Material and Design Integrating physics data for DL in DED
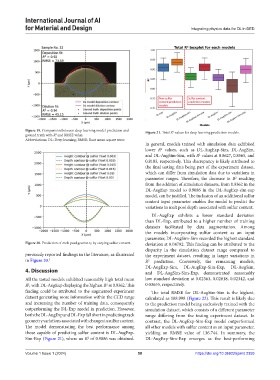
Figure 19. Comparison between deep learning model prediction and Figure 21. Total R values for deep learning prediction models.
2
2
ground truth with R and RMSE value.
Abbreviations: DL: Deep learning; RMSE: Root mean square error.
In general, models trained with simulation data exhibited
2
lower R values, such as DL-AugExp-Sim, DL-AugSim,
and DL-AugSim-Sim, with R values at 0.8627, 0.8565, and
2
0.8103, respectively. This discrepancy is likely attributed to
the final testing data being part of the experiment dataset,
which can differ from simulation data due to variations in
2
parameter ranges. Therefore, the decrease in R resulting
from the addition of simulation datasets, from 0.9362 in the
DL-AugExp model to 0.9086 in the DL-AugExp-sim-exp
model, can be justified. The inclusion of an additional sulfur
content input parameter enables the model to predict the
variations in melt pool depth associated with sulfur content.
DL-AugExp exhibits a lower standard deviation
than DL-Exp, attributed to a higher number of training
datasets facilitated by data augmentation. Among
the models incorporating sulfur content as an input
parameter, DL-AugSim-Sim recorded the highest standard
Figure 20. Prediction of melt pool geometry by varying sulfur content. deviation at 0.04792. This finding can be attributed to the
disparity in the simulation dataset range compared to
previously reported findings in the literature, as illustrated the experiment dataset, resulting in larger variations in
in Figure 20. 2 R prediction. Conversely, the remaining models,
2
DL-AugExp-Sim, DL-AugExp-Sim-Exp, DL-AugSim,
4. Discussion and DL-AugSim-Sim-Exp, demonstrated reasonably
All the tested models exhibited reasonably high total mean low standard deviation at 0.02363, 0.02818, 0.02342, and
2
R , with DL-AugExp displaying the highest R at 0.9362. This 0.03655, respectively.
2
finding could be attributed to the augmented experiment The total RMSE for DL-AugSim-Sim is the highest,
dataset generating more information within the CCD range calculated as 188.998 (Figure 22). This result is likely due
and increasing the number of training data, consequently to the prediction model being exclusively trained with the
outperforming the DL-Exp model in prediction. However, simulation dataset, which consists of a different parameter
both the DL-AugExp and DL-Exp fall short in predicting track range differing from the testing experiment dataset. In
geometry variations associated with changes in sulfur content. contrast, the DL-AugExp-Sim-Exp model outperformed
The model demonstrating the best performance among all other models with sulfur content as an input parameter,
those capable of predicting sulfur content is DL-AugExp- yielding an RMSE value of 136.744. In summary, the
Sim-Exp (Figure 21), where an R of 0.9086 was obtained. DL-AugExp-Sim-Exp emerges as the best-performing
2
Volume 1 Issue 1 (2024) 58 https://doi.org/10.36922/ijamd.2355