
Page 43 - IJAMD-1-3
P. 43
International Journal of AI for
Materials and Design
Metal AM porosity prediction using ML
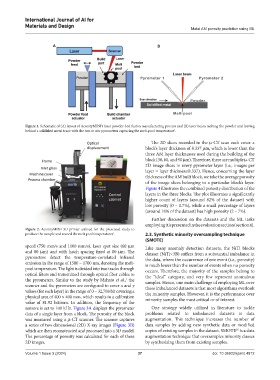
A B
Figure 1. Schematic of (A) layout of AconityMINI’s laser powder-bed fusion manufacturing process and (B) laser beam melting the powder and leaving
behind a solidified metal trace with the two in situ pyrometers capturing the melt-pool temperature . 1
The 2D slices recorded in the µ-CT scan each cover a
block’s layer thickness of 8.337 µm, which is lower than the
three AM layer thicknesses used during the building of the
block (30, 60, and 90 µm). Therefore, there are multiple µ-CT
2D image slices in every pyrometer layer (i.e., images per
layer = layer thickness/8.337). Hence, concerning the layer
thickness of the AM built block, we take the average porosity
of the image slices belonging to a particular block’s layer.
Figure 4 illustrates the combined porosity distribution of the
layers in the three blocks. The plot illustrates a significantly
higher count of layers (around 82% of the dataset) with
low porosity (0 – 0.7%), while a small percentage of layers
(around 18% of the dataset) has high porosity (2 – 7%).
Further discussion on the datasets and the ML tasks
employing it is presented in the evaluation section (section 4).
Figure 2. AconityMINI 3D printer utilized for the presented study to
produce the sample and record the melt pool temperatures . 1 2.3. Synthetic minority oversampling technique
(SMOTE)
speed (750 mm/s and 1100 mm/s), laser spot size (60 µm Like many anomaly detection datasets, the NiTi blocks
and 80 µm) and with hatch spacing fixed at 80 µm. The dataset (NiTi×3B) suffers from a substantial imbalance in
pyrometers detect the temperature-correlated infrared the data, where the occurrence of one event (i.e., porosity)
emission in the range of 1500 – 1700 nm, denoting the melt- is much lower than the number of events when no porosity
pool temperature. The light is divided into two tracks through occurs. Therefore, the majority of the samples belong to
optical filters and transmitted through optical fiber cables to the “ideal” category, and very few represent anomalous
the pyrometers. Similar to the study by Mahato et al., the samples. Hence, one main challenge of employing ML over
1
scanner and the pyrometers are configured to cover x and y these imbalanced datasets is that most algorithms overlook
values (for each layer) in the range of 0 – 32,768 bit covering a the minority samples. However, it is the performance over
physical area of 400 × 400 mm, which results in a calibration minority samples the most critical or of interest.
value of 81.92 bit/mm. In addition, the frequency of the
sensors is set to 100 kHz. Figure 3A displays the pyrometer One strategy widely utilized in literature to tackle
data of a single layer from a block. The porosity of the block problems related to imbalanced datasets is data
was measured using a µ-CT scanner. The scanner captures augmentation. This technique increases the number of
a series of two dimensional (2D) X-ray images (Figure 3B) data samples by adding new synthetic data or modified
which are then reconstructed and processed into a 3D model. copies of existing samples in the dataset. SMOTE is a data
35
The percentage of porosity was calculated for each of these augmentation technique that oversamples minority classes
2D images. by synthesizing them from existing samples.
Volume 1 Issue 3 (2024) 37 doi: 10.36922/ijamd.4812