
Page 47 - IJAMD-1-3
P. 47
International Journal of AI for
Materials and Design
Metal AM porosity prediction using ML
Elimination with Cross‑Validation (RFECV) from the models using 10-fold cross-validation. For the cross-
Scikit‑learn library on the post‑SMOTE‑ENN or SMOTER validation mechanism (repeated Stratified K‑Fold with
dataset to achieve this. The idea is to eliminate irrelevant the number of splits and repeats was employed). Based on
features for the intended ML task that TS-Fresh might the cross-validated scores obtained by these models, we
have introduced. Furthermore, we split the final dataset selected the best performing model (model ). In the next
best
obtained after the RFECV stage into a train and test dataset stage, model best went through intensive parameter tuning
of size 67% and 33% of the total observations, respectively. (cross-validated on the training set) to discover the best
We held off the test dataset until the final evaluation. set of parameters to enhance its performance. We gauged
We employed the training data and evaluated all the the true performance of the model best by supplying it with
the best parameters obtained in the last stage, training it
over the training data, and evaluating its performance over
the held-out test data. This evaluation pipeline’s robustness
Data preprocessing
Dataset guarantees that the ML model’s final evaluation scores
reflect its performance in unseen real-world environment
TS-Fresh or data.
The regression task is defined as predicting the porosity
SMOTE-ENN or percentage of a given layer. We targeted this ML task
SMOTER with two different regression models, motivated by the
significant divergence in porosity versus layer counts
distributions observed in Figure 4. Therefore, the two
RFECV
regression tasks we created are associated with the two
different datasets resulting from splitting the original
Split data dataset into “low” and “high” porosity layers (Figure 7).
Train Test The rationale behind this choice is that distinguishing
data data between low and high porosity is easy. A simple
classification algorithm should be able to achieve that.
Cross-validated However, when predicting the actual porosity percentage
evaluation on all of the layer, we need ad-hoc models capable of capturing
models
the subtle differences in the temperature fluctuation during
Parameter Tuning the formation of pores. Therefore, to avoid regression
on Best Model models inclining to either low- or high-porosity samples
owing to the frequency of occurrence of either one of
Train on tuned best Evaluate on Score them, we targeted the problem with two models: one for
model test data low-porosity layers and another for high-porosity layers.
Figure 6. Evaluation pipeline employed in this study Given a query q, the suited regression model tries to
Abbreviations: ENN: Edited Nearest Neighbor; RFECV: Recursive
Feature Elimination with Cross‑Validation; SMOTE: Synthetic minority predict the exact porosity percentage (i.e., the target or
oversampling technique; SMOTER: SMOTE for Regression. dependent variable). Predicting the porosity percentage of
A B
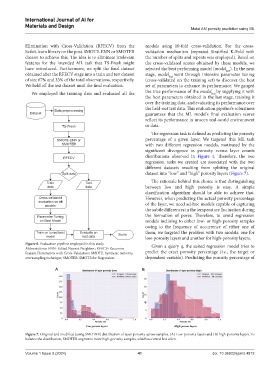
Figure 7. Original and modified (using SMOTER) distribution of layer porosity across samples. (A) Low‑porosity layers and (B) high‑porosity layers. To
balance the distribution, SMOTER augments more high‑porosity samples, which occurred less often.
Volume 1 Issue 3 (2024) 41 doi: 10.36922/ijamd.4812