
Page 50 - IJAMD-1-3
P. 50
International Journal of AI for
Materials and Design
Metal AM porosity prediction using ML
mechanism allows it to handle complex patterns in the Repeated Stratified K‑Fold with the number of splits and
data efficiently, while also offering adaptability through repeats was employed. The system is only exposed to the
hyperparameter tuning, making it a popular choice in ML training data for hyperparameter optimization. Figure 9
literature for large-scale classification tasks. Conversely, illustrates the model accuracies across the training
k-NN, though less efficient with large datasets due to instances (i.e., iterations). Here, it can be observed that the
the need to compute distances between all points, was best parameters render a mean accuracy of the k-NN model
used for its simplicity and interpretability. It provides a around 69% on training data. The k‑NN model was trained
straightforward approach to classification by relying on on training data supplied with the best parameters obtained
proximity in feature space. By employing both models, in the previous step and evaluated it on the held-out test
we ensure that XGBoost handles complex, non-linear data. As a result, the model predicts the classes of the held-
classifications efficiently, while k-NN provides a valuable out samples with an accuracy of 65%. Undergoing a cross‑
comparison through its simpler, distance-based approach. validated hyper-parameter tuning process for XGBoost on
For obtaining the best set of parameters of the k-NN training data, the best set of parameters obtained are as
and XGBoost model, Grid SearchCV from the sklearn3 follows: learning rate = 0.01, estimators = 400, gamma = 5,
library was employed. For the cross-validation mechanism, max depth = 5, min child weight = 10, subsample = 1.0,
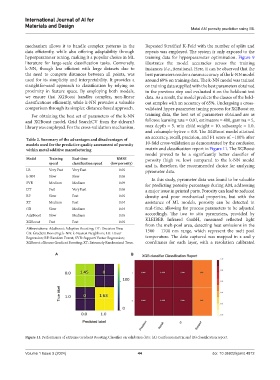
and colsample-bytree = 0.8. The XGBoost model attained
Table 2. Summary of the advantages and disadvantages of an accuracy, recall, precision, and F1 score of ~100% after
models used for the predictive quality assessment of porosity 10-fold cross-validation as demonstrated by the confusion
within metal additive manufacturing matrix and classification report in Figure 11. The XGBoost
model proved to be a significantly better classifier of
Model Training Real‑time RMSE porosity (high vs. low) compared to the k-NN model
speed classification speed (low porosity)
and is, therefore, the recommended choice for analyzing
LR Very Fast Very Fast 0.05 pyrometer data.
k-NN Slow Slow 0.06 In this study, pyrometer data was found to be valuable
SVR Medium Medium 0.09 for predicting porosity percentage during AM, addressing
DT Fast Very Fast 0.06 a major issue in printed parts. Porosity can lead to reduced
RF Slow Fast 0.05 density and poor mechanical properties, but with the
XT Medium Fast 0.04 assistance of ML models, porosity can be detected in
GB Slow Medium 0.04 real-time, allowing for process parameters to be adjusted
AdaBoost Slow Medium 0.05 accordingly. The two in situ pyrometers, provided by
XGBoost Fast Fast 0.05 KLEIBER Infrared GmbH, measured reflected light
from the melt-pool area, detecting heat emissions in the
Abbreviations: AdaBoost: Adaptive Boosting; DT: Decision Tree; 1500 – 1700 nm range, which represent the melt pool
GB: Gradient Boosting; k-NN: k-Nearest Neighbors; LR: Linear
Regression; RF: Random Forest; SVR: Support Vector Regression; temperature. The data captured was mapped in x and y
XGBoost: eXtreme Gradient Boosting; XT: Extremely Randomized Trees. coordinates for each layer, with a resolution calibrated
A B
Figure 11. Performance of eXtreme Gradient Boosting Classifier on validation data: (A) Confusion matrix and (B) classification report.
Volume 1 Issue 3 (2024) 44 doi: 10.36922/ijamd.4812