
Page 46 - IJAMD-1-3
P. 46
International Journal of AI for
Materials and Design
Metal AM porosity prediction using ML
automotive industries. This has resulted in the availability evaluating regression models. Lastly, an evaluation matrix,
of big temporally annotated datasets, generally known as using previously unseen data, called absolute error matrix,
time series. Like many others, these time-series datasets was also employed during model validation.
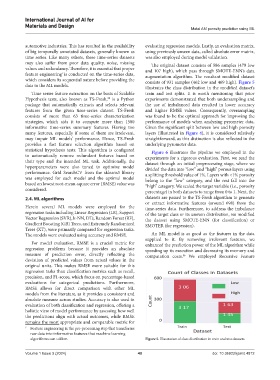
may also suffer from poor data quality, noise, missing The original dataset consists of 586 samples (479 low
values and redundancy. Therefore, it is essential that proper and 107 high), which pass through SMOTE‑ENN’s data
feature engineering is conducted on the time-series data, augmentation algorithm. The resultant modified dataset
1
which considers its sequential nature before providing the consists of 931 samples (462 low and 469 high). Figure 5
data to the ML models. illustrates the class distribution in the modified dataset’s
Time series feature extraction on the basis of Scalable train and test splits. It is worth mentioning that prior
Hypothesis tests, also known as TS-Fresh, is a Python experiments demonstrated that both undersampling and
38
package that automatically extracts and selects relevant the use of imbalanced data resulted in lower accuracy
features from the given time-series dataset. TS-Fresh and higher RMSE values. Consequently, oversampling
consists of more than 63 time-series characterization was found to be the optimal approach for improving the
strategies, which aids it to compute more than 1500 performance of models when analyzing pyrometer data.
informative time-series summary features. Having too Given the significant split between low and high porosity
many features, especially if some of them are irrelevant, layers (illustrated in Figure 4), it is considered relatively
may impair ML models’ performance. Hence, TS-Fresh straightforward, as this distinction is also reflected in the
provides a fast feature selection algorithm based on underlying pyrometer data.
statistical hypothesis tests. This algorithm is configured Figure 6 illustrates the pipeline we employed in the
to automatically remove redundant features based on experiments for a rigorous evaluation. First, we read the
their type and the intended ML task. Additionally, the dataset through an initial preprocessing stage, where we
hyperparameters were also tuned to optimize model divided the data into “low” and “high” porous layers using
performance. Grid SearchCV from the sklearn3 library a splitting threshold value of 1%. Layers with <1% porosity
was employed for each model and the optimal model belong to the “low” category, and the rest fall into the
based on lowest root‑mean‑square error (RMSE) value was “high” category. We scaled the target variable (i.e., porosity
considered. percentage) in both datasets to range from 0 to 1. Next, the
2.4. ML algorithms datasets are passed to the TS-Fresh algorithm to generate
or extract informative features (around 698) from the
Herein several ML models were employed for the time-series data. Furthermore, to address the imbalance
regression tasks including Linear Regression (LR), Support of the target class or its uneven distribution, we modified
Vector Regression (SVR), k‑NN, DTs, Random Forest (RF), the dataset using SMOTE‑ENN (for classification) or
Gradient Boosting (GB) Trees, and Extremely Randomized SMOTER (for regression).
Trees (XT), were primarily compared for regression tasks.
The models were evaluated using accuracy and RMSE. An ML model is as good as the features in the data
supplied to it. By removing irrelevant features, we
For model evaluation, RMSE is a crucial metric for enhanced the prediction power of the ML algorithm while
regression problems because it provides an absolute speeding up its execution and decreasing its memory and
measure of prediction error, directly reflecting the computation costs. We employed Recursive Feature
56
deviation of predicted values from actual values in the
original units. This makes RMSE more suitable for this
regression tasks than classification metrics such as recall,
precision, and F1-score, which focus on percentage-based
evaluations for categorical predictions. Furthermore,
RMSE allows for direct comparison with other ML
models from the literature, as it provides a consistent and
absolute measure across studies. Accuracy is also used in
evaluation of both classification and regression, offering a
holistic view of model performance by assessing how well
the predictions align with actual outcomes, while RMSE
remains the most appropriate and comparable metric for
1 Feature engineering is the pre-processing step that transforms
raw data into informative features that machine learning
algorithms can utilize. Figure 5. Illustration of class distribution in train and test datasets
Volume 1 Issue 3 (2024) 40 doi: 10.36922/ijamd.4812