
Page 308 - IJB-10-1
P. 308
International Journal of Bioprinting Low-cost quad-extrusion 3D bioprinting system
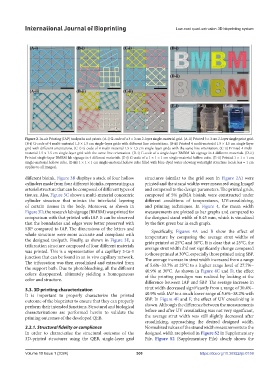
Figure 2. In-air Printing (IAP) toolpaths and prints. (A-i) G-code of a 3 × 3 cm 2-layer single-material grid. (A-ii) Printed 3 × 3 cm 2-layer single print grid.
(B-i) G-code of 4 multi-material 1.5 × 1.5 cm single-layer grids with different line orientations. (B-ii) Printed 4 multi-material 1.5 × 1.5 cm single-layer
grid with different orientations. (C-i) G-code of 4 multi-material 1.5 × 1.5 cm single-layer grids with the same line orientation. (C-ii) Printed 4 multi-
material 1.5 × 1.5 cm single-layer grid with the same line orientation. (D-i) G-code of a single-layer BMBM lab signage in 4 different materials. (D-ii)
Printed single-layer BMBM lab signage in 4 different materials. (E-i) G-code of a 1 × 1 × 1 cm single-material hollow cube. (E-ii) Printed 1 × 1 × 1 cm
single-material hollow cube. (E-iii) 1 × 1 × 1 cm single-material hollow cube filled with blue-dyed water showing watertight structure (scale bar = 1 cm
applies to all images).
different bioink. Figure 3B displays a stack of four hollow structures (similar to the grid seen in Figure 2A) were
cylinders made from four different bioinks, representing an printed and the strand widths were measured using ImageJ
arterial structure that can be composed of different types of and compared to the design parameters. The printed grids,
tissues. Also, Figure 3C shows a multi-material concentric composed of 5% gelMA bioink, were constructed under
cylinder structure that mimics the interfacial layering different conditions of temperatures, UV-crosslinking,
of certain tissues in the body. Moreover, as shown in and printing techniques. In Figure 4, the mean width
Figure 3D, the research lab signage (BMBM) was printed for measurements are plotted as bar graphs and compared to
comparison with that printed with IAP. It can be observed the designed stand width of 0.45 mm, which is visualized
that the boundaries and edges were better preserved with by the first green bar in each graph.
SBP compared to IAP. The dimensions of the letters and Specifically, Figures 4A and B show the effect of
whole structure were more accurate and compliant with temperature by comparing the average strut widths of
the designed toolpath. Finally, as shown in Figure 3E, a grids printed at 25°C and 30°C. It is clear that at 25°C, the
trifurcation structure composed of four different materials average strut width did not significantly change compared
was printed. This is a representation of a capillary 3-to-1 to those printed at 30°C, especially those printed using SBP.
junction that can be found in an in vivo capillary network. The average increase in strut width increased from a range
The trifurcation was then crosslinked and extracted from of 5.6%–33.7% at 25°C to a higher range level of 27.7%–
the support bath. Due to photobleaching, all the different 40.9% at 30°C. As shown in Figure 4C and D, the effect
colors disappeared, ultimately yielding a homogeneous of the printing paradigm was realized by looking at the
color and structure. difference between IAP and SBP. The average increase in
3.3. 3D printing characterization strut width decreased significantly from a range of 30.4%–
It is important to properly characterize the printed 40.9% with IAP to a much lower range of 5.6%–38.2% with
outcome of the bioprinter to ensure that they can properly SBP. In Figure 4E and F, the effect of UV crosslinking is
perform their intended functions. Structural and biological shown. Although the difference between the measurements
characterizations are performed herein to validate the before and after UV crosslinking was not very significant,
printing outcomes of the developed QEB. the average strut width was still slightly decreased after
crosslinking, approaching the desired designed width.
3.3.1. Structural fidelity or compliance Normalized values of the strand width measurements to the
In order to characterize the structural outcome of the designed width are plotted in Figure S2 in Supplementary
3D-printed structures using the QEB, single-layer grid File. Figure S2 (Supplementary File) clearly shows the
Volume 10 Issue 1 (2024) 300 https://doi.org/10.36922/ijb.0159