
Page 309 - IJB-10-1
P. 309
International Journal of Bioprinting Low-cost quad-extrusion 3D bioprinting system
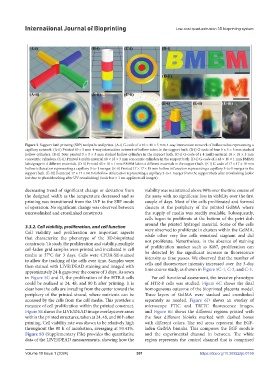
Figure 3. Support bath printing (SBP) toolpaths and prints. (A-i) G-code of a 40 × 40 × 5 mm 4-way intersection network of hollow tubes representing a
capillary network. (A-ii) Printed 40 × 5 mm 4-way intersection network of hollow tubes in the support bath. (B-i) G-code of four 5 × 5 × 5 mm stacked
hollow cylinders. (B-ii) Four printed 5 × 5 × 5 mm stacked hollow cylinders in the support bath. (C-i) G-code of a 4 multi-material 18 × 18 × 3 mm
concentric cylinders. (C-ii) Printed 4 multi-material 18 × 18 × 3 mm concentric cylinders in the support bath. (D-i) G-code of a 48 × 10 × 1 mm BMBM
lab signage in 4 different materials. (D-ii) Printed 45 × 10 × 1 mm BMBM lab in 4 different materials in the support bath. (E-i) G-code of 17 × 17 × 18 mm
hollow trifurcation representing a capillary 3-to-1 merger. (E-ii) Printed 17 × 17 × 18 mm hollow trifurcation representing a capillary 3-to-1 merger in the
support bath. (E-iii) Extracted 17 × 17 × 18 mm hollow trifurcation representing a capillary 3-to-1 merger from the support bath after crosslinking (color
lost due to photobleaching after UV crosslinking) (scale bar = 1 cm applies to all images).
decreasing trend of significant change or deviation from viability was maintained above 90% over the time course of
the designed width as the temperature decreased and as the assay with no significant loss in viability over the first
printing was transitioned from the IAP to the SBP mode couple of days. Most of the cells proliferated and formed
of operation. No significant change was observed between clusters at the periphery of the printed GelMA where
uncrosslinked and crosslinked constructs. the supply of media was readily available. Subsequently,
cells began to proliferate at the bottom of the petri dish
3.3.2. Cell viability, proliferation, and cell function around the printed hydrogel material. Some of the cells
Cell viability and proliferation are important aspects were observed to proliferate in clusters within the GelMA,
that characterize the phenotype of the 3D-bioprinted while other very few cells remained stagnant and did
constructs. To study the proliferation and viability, multiple not proliferate. Nevertheless, in the absence of staining
cell-laden grid samples were printed and incubated in cell of proliferation marker such as Ki67, proliferation can
media at 37°C for 3 days. Cells were CFDA-SE-stained be detected by the significant increase in fluorescence
to allow the tracking of the cells over time. Samples were intensity as time passes. We observed that the number of
then stained with LIVE/DEAD staining and imaged with cells and fluorescence intensity increased over the 3-day
approximately 24-h gaps over the course of 3 days. As sown time course study, as shown in Figure 5C-1, C-2, and C-3.
in Figure 5C and D, the proliferation of the HTR-8 cells For cell functional assessment, the invasive phenotype
could be realized at 24, 48, and 80 h after printing. It is of HTR-8 cells was studied. Figure 6C shows the final
clear how the cells are invading from the center toward the homogeneous outcome of the bioprinted placenta model.
periphery of the printed strand, where nutrients can be Three layers of GelMA were stacked and crosslinked
accessed by the cells from the cell media. This provides a separately as needed. Figure 6D shows an overlay of
measure of cell proliferation within the printed construct. microscope FTIC and TRITC fluorescence images,
Figure 5E shows the LIVE/DEAD image overlays over areas and Figure 6E shows the different regions printed with
within the printed structures, taken at 24, 48, and 80 h after the four different bioinks marked with dashed boxes
printing. Cell viability rate was shown to be relatively high with different colors. The red areas represent the EGF-
throughout the 80 h of incubation, averaging at 93.41%. laden GelMA bioinks. This composes the EGF module
Figure S3 (Supplementary File) provides the quantitative and the experimental channel in between. The white
data of the LIVE/DEAD measurements, showing how the region represents the control channel that is comprised
Volume 10 Issue 1 (2024) 301 https://doi.org/10.36922/ijb.0159