
Page 225 - IJB-10-2
P. 225
International Journal of Bioprinting Property of scaffolds with different lattices
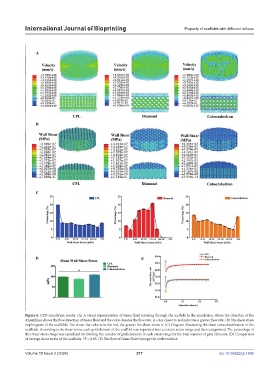
Figure 6. CFD simulation results. (A) A visual representation of tissue fluid traveling through the scaffold in the simulation, where the direction of the
streamlines shows the flow direction of tissue fluid and the color denotes the flow rate. A color closer to red indicates a greater flow rate. (B) The shear stress
nephrogram of the scaffolds. The closer the color is to the red, the greater the shear stress is. (C) Diagram illustrating the shear stress distribution of the
scaffolds. According to its shear stress, each grid element of the scaffold was separated into a certain stress range and then categorized. The percentage of
this shear stress range was calculated by dividing the number of grid elements in each stress range by the total number of grid elements. (D) Comparison
of average shear stress of the scaffolds. *P < 0.05. (E) The flow of tissue fluid through the outlet surface.
Volume 10 Issue 2 (2024) 217 doi: 10.36922/ijb.1698