
Page 226 - IJB-10-2
P. 226
International Journal of Bioprinting Property of scaffolds with different lattices
Table 5. Calculated specific surface area and permeability values
-10
2
-1
3
2
Lattice S (mm ) V (mm ) (mm ) V max (mm/s) V mean (mm/s) (Pa) K (10 m )
S
CPL 287.8366 75.0299 17.16 3.789 0.7499 5.2229 0.1755
Diamond 867.1071 86.6514 10.01 4.694 0.8782 2.5574 0.7197
Cuboctahedron 1125.7823 81.1718 13.87 4.989 0.8730 4.4625 0.2391
Note: δ represents the specific surface area; S represents the internal surface area and refers to the interface between solid and pore in the porous structure; V depicts the
S
volume of the porous structure; V max represents the maximum flow velocity; V mean is the average flow velocity; Δp is the pressure gradient when the fluid passes through the
scaffold; and K is the permeability.
although the distribution range of shear stress of CPL and of porous scaffolds using CFD, Omar et al. and Li et al.
52
38
cuboctahedron scaffolds was relatively broad (0 to >200 found that the value is in the tens of millipascals (MPa),
MPa), the recorded shear stress of the scaffolds mostly consistent with our experimental results, indicating that
falls within the range of 0–20 MPa, whereas the shear the simulation analysis has a good authenticity.
stress distribution range of the diamond scaffold was
more concentrated (0–180 MPa), with the majority of the 3.4. Cell adhesion and proliferation
recorded values falling within the range of 120–140 MPa. After 3 h of co-culture with mouse MC3T3-E1 cells,
It is evident that the variation of unit cells has a significant acridine orange staining revealed a substantial level of cell
impact on the value and distribution of shear stress in attachment in Ti6Al4V scaffolds with various unit cells
scaffolds. Through their shear stress distribution analysis (Figure 7A). CCK8 assay results revealed that the number
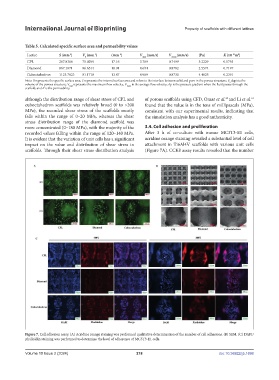
Figure 7. Cell adhesion assay. (A) Acridine orange staining was performed qualitative determination of the number of cell adhesions. (B) SEM. (C) DAPI/
phalloidin staining was performed to determine the level of adherence of MC3T3-E1 cells.
Volume 10 Issue 2 (2024) 218 doi: 10.36922/ijb.1698