Page 332 - IJB-10-2
P. 332

International Journal of Bioprinting                                Continuous gradient TPMS bone scaffold


                            Figure 13. Human femur structure. Adapted with permission from ref.43 (Copyright © 2016, Elsevier).


            define two points in a linear function as (Y , 1), (Y max , e).    The function expression of the periodic parameter is
                                              min
            Using the two-point method, the coefficients in the linear   shown in Equation XVII. The unknown number expression
            function can be obtained, quorum k =(n−1)/(Y max − Y ),  in the formula is:
                                                       min
                                                  ky C
            C = −Y min   *  k + 1. For  d y ()   y ()    1 .
                                           y
             1
            It can be obtained by using the solution of the                  k  ( n 1 )/( Y max   Y min )
                                                                              1

                                                                                          k 1
            first-order  non-homogeneous   linear  equation                    C  Y min             (XIX)
                                                                                 1
                 k         C                1                                       1    2
                                                2
             ()y    2     1  y 0  , quorum  C =  2 kY min . Sorting         C   2 k Y  min
                    yC
                                                                                  0
                                         0

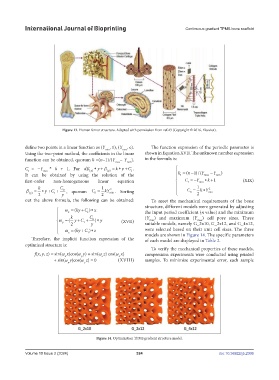
            out the above formula, the following can be obtained:  To meet the mechanical requirements of the bone
                                                               structure, different models were generated by adjusting
                              ( ky C  )  x                 the input period coefficient (n value) and the minimum

                             x  k    1 C                      (Y  )  and maximum  (Y  )  cell  pore  sizes. Three


                                                                 min
                                                                                     max
                            (  yC    0   )  y   (XVII)    suitable models, namely G_2x10, G_2x12, and G_4x12,
                                     1
                            y
                              2        y
                              ( ky C  )  z                 were selected based on their unit cell sizes. The three


                                      1
                              z
               Therefore, the implicit function expression of the   models are shown in Figure 14. The specific parameters
                                                               of each model are displayed in Table 2.
            optimized structure is:
                                                                  To verify the mechanical properties of these models,
                f(x, y, z) = sin(ω x)cos(ω y) + sin(ω z) cos(ω x)    compression experiments were conducted using printed
                                    y
                                            z
                                                    x
                             x
                                       + sin(ω y)cos(ω z) = 0   (XVIII)   samples.  To minimize  experimental  error, each  sample
                              y      z
                                          Figure 14. Optimization TPMS gradient structure model.

            Volume 10 Issue 2 (2024)                       324                                doi: 10.36922/ijb.2306
   327   328   329   330   331   332   333   334   335   336   337