
Page 396 - IJB-10-2
P. 396
International Journal of Bioprinting Automated bioink mixer improves bioprinting
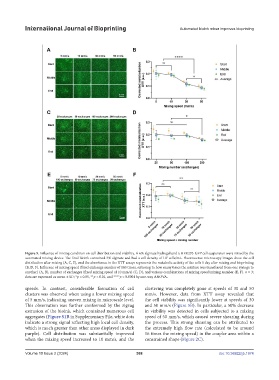
Figure 5. Influence of mixing condition on cell distribution and viability. A 6% alginate hydrogel and a HEK293-GFP cell suspension were mixed by the
7
automated mixing device. The final bioink contained 3% alginate and had a cell density of 10 cells/mL. Fluorescence microscopy images show the cell
distribution after mixing (A, C, E), and the absorbance in the XTT assays represents the metabolic activity of the cells 1 day after mixing and bioprinting
(B, D, F). Influence of mixing speed (fixed exchange number of 100 times, referring to how many times the mixture was transferred from one syringe to
another) (A, B), number of exchanges (fixed mixing speed of 10 mm/s) (C, D), and various combinations of mixing speed/mixing number (E, F). n = 3;
data are expressed as mean ± SD; *p < 0.05, **p < 0.01, and ****p < 0.0001 by one-way ANOVA.
speeds. In contrast, considerable formation of cell clustering was completely gone at speeds of 30 and 50
clusters was observed when using a lower mixing speed mm/s. However, data from XTT assay revealed that
of 5 mm/s, indicating uneven mixing in microscale level. the cell viability was significantly lower at speeds of 30
This observation was further conformed by the zigzag and 50 mm/s (Figure 5B). In particular, a 50% decrease
extrusion of the bioink, which contained numerous cell in viability was detected in cells subjected to a mixing
aggregates (Figure S1B in Supplementary File, white dots speed of 50 mm/s, which caused severe shearing during
indicate a strong signal reflecting high local cell density, the process. This strong shearing can be attributed to
which is much greater than other areas displayed in dark the extremely high flow rate (calculated to be around
purple). Cell distribution was substantially improved 16 times the mixing speed) in the coupler area within a
when the mixing speed increased to 10 mm/s, and the constrained shape (Figure 2C).
Volume 10 Issue 2 (2024) 388 doi: 10.36922/ijb.1974