
Page 215 - IJB-10-3
P. 215
International Journal of Bioprinting Sr on GO enhances PLLA/PGA scaffold
in Figure 6a. As time elapsed, the cells expanded and were cells/mm , respectively, on day 5, which were much higher
2
accompanied by a large number of prominent pseudopodia than that on day 1. LG/GPSr1.5 exhibited a higher BMSCs
on both scaffolds. 72,73 The quantitative analysis of relative cell density than the LG scaffold when cultured for the same
adhesion area was carried out, and the results are presented period of time. This might be due to the fact that the GPSr
in Figure 6b. As time prolonged, the relative cell adhesion in the LG/GPSr1.5 scaffold increased surface roughness of
area on the surface of the LG and LG/GPSr1.5 scaffolds the scaffold, providing more adhesion sites for BMSCs and
gradually increased and reached 31.68% and 40.72% on day thus promoting cell adhesion and growth. 76,77 The results
5, respectively. The LG/GPSr1.5 scaffold exhibited a larger of living/dead cell staining and cell adhesion showed that
relative cell adhesion area than the LG scaffold at each period. the LG/GPSr1.5 scaffold possessed good cytocompatibility.
The results of live/dead cell staining experiments Since osteoblast differentiation was a prerequisite for
after BMSCs being cultured on the LG and LG/GPSr1.5 bone regeneration, the role of the LG/GPSr1.5 scaffold in
scaffolds for 1, 3, and 5 days are shown in Figure 6c; the live inducing osteogenic differentiation of BMSCs was studied,
and dead cells were stained in green and red, respectively. with the LG scaffold as the control group. ALP staining
Both scaffolds were able to maintain survival of almost all test was conducted to evaluate the activity of ALP which
inoculated cells, and it has been found that the number reflected the early mature osteoblasts. 78,79 The secretions
of live cells gradually increased with the culture time. 74,75 of OCN and OPN were generally considered to be the
As shown in Figure 6d, the cell densities on the LA and main markers of late differentiation of osteoblasts, so the
LG/GPSr1.5 scaffolds were 310.52 cells/mm and 398.32 expression of osteogenesis-related genes was evaluated by
2
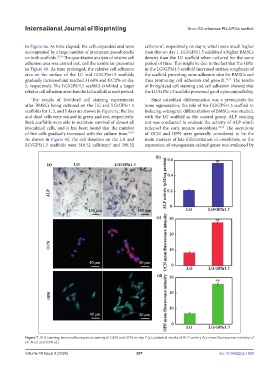
Figure 7. ALP staining, immunofluorescence staining of OCN and OPN on day 7 (a); statistical results of ALP activity (b); mean fluorescence intensity of
OCN (c) and OPN (d).
Volume 10 Issue 3 (2024) 207 doi: 10.36922/ijb.1829