
Page 406 - IJB-10-3
P. 406
International Journal of Bioprinting In situ thermal monitoring in bioprinting
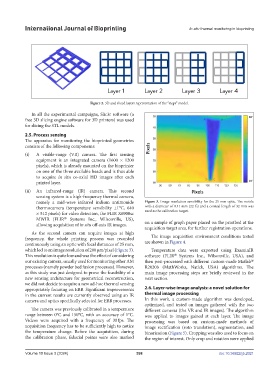
Figure 2. 3D and sliced layers representation of the “steps” model.
In all the experimental campaigns, Slic3r software (a
free 3D slicing engine software for 3D printers) was used
for slicing the STL models.
2.5. Process sensing
The apparatus for monitoring the bioprinted geometries
consists of the following components:
(i) A visible-range (VR) camera. The first sensing
equipment is an integrated camera (1600 × 1200
pixels), which is already mounted on the bioprinter
on one of the three available heads and is thus able
to acquire in situ co-axial HD images after each
printed layer.
(ii) An infrared-range (IR) camera. This second
sensing system is a high-frequency thermal camera,
namely a mid-wave infrared indium antimonide Figure 3. Image resolution sensibility for the 25 mm optic. The nozzle
thermocamera (temperature sensibility ±1°C, 640 with a diameter of 0.41 mm (22 G) and a conical length of 32 mm was
× 512 pixels) for video detection, the FLIR X6900sc used as the calibration target.
®
MWIR (FLIR Systems Inc., Wilsonville, US),
allowing acquisition of in situ off-axis IR images. on a sample of graph paper placed on the printbed at the
acquisition target area, for further registration operations.
As the second camera can acquire images at high
frequency, the whole printing process was recorded The image acquisition environment conditions tested
continuously using an optic with focal distances of 25 mm, are shown in Figure 4.
which led to an image resolution of 200 µm/pixel (Figure 3). Temperature data were exported using ExaminIR
®
This resolution is quite low and was the effect of considering software (FLIR Systems Inc., Wilsonville, USA), and
our existing camera, usually used for monitoring other AM then post-processed with different custom-made Matlab
®
processes (namely powder bed fusion processes). However, R2020b (MathWorks, Natick, USA) algorithms. The
as this study was just designed to prove the feasibility of a main image processing steps are briefly reviewed in the
new sensing architecture for geometrical reconstruction, next section.
we did not decide to acquire a new ad-hoc thermal sensing
appropriately focusing on EBB. Significant improvements 2.6. Layer-wise image analysis: a novel solution for
in the current results are currently observed using an IR thermal image processing
camera and optics specifically selected for EBB processes. In this work, a custom-made algorithm was developed,
optimized, and tested on images gathered with the two
The camera was previously calibrated in a temperature different cameras (the VR and IR images). The algorithm
range between 0°C and 150°C, with an accuracy of 1°C. was applied to images gained at each layer. The image
Videos were acquired with a frequency of 30 fps. The processing was based on custom-made methods of
acquisition frequency has to be sufficiently high to notice image rectification (roto translation), segmentation, and
the temperature change. Before the acquisition, during binarization (Figure 5). Cropping was also used to focus on
the calibration phase, fiducial points were also marked the region of interest. Only crop and rotation were applied
Volume 10 Issue 3 (2024) 398 doi: 10.36922/ijb.2021