
Page 504 - IJB-10-3
P. 504
International Journal of Bioprinting 3D printing microgroove nerve conduits
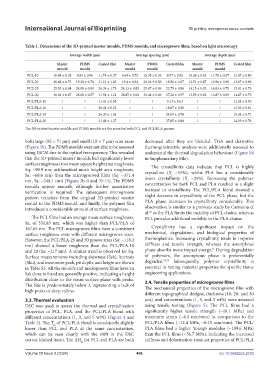
Table 1. Dimensions of the 3D-printed master moulds, PDMS moulds, and microgroove films, based on light microscopy
Average width (μm) Average spacing (μm) Average depth (μm)
Master PDMS Casted film Master PDMS Casted film Master PDMS Casted film
mould mould mould mould mould mould
PCL-10 10.44 ± 0.38 9.53 ± 0.56 11.74 ± 0.37 9.69 ± 0.75 10.35 ± 0.36 8.97 ± 0.56 10.38 ± 0.52 11.78 ± 0.67 12.47 ± 0.89
PCL-20 20.44 ± 0.73 19.28 ± 0.78 21.21 ± 1.03 19.4 ± 0.84 20.24 ± 0.56 18.56 ± 0.67 12.51 ± 0.87 12.96 ± 0.90 13.67 ± 0.66
PCL-25 25.52 ± 0.64 24.08 ± 0.81 26.39 ± 1.73 24.13 ± 0.85 25.47 ± 0.49 23.75 ± 0.86 14.15 ± 0.92 14.83 ± 0.75 15.91 ± 0.73
PCL-30 30.61 ± 0.67 28.68 ± 0.57 31.94 ± 1.21 28.85 ± 0.64 30.44 ± 0.66 27.28 ± 0.97 13.59 ± 0.63 13.87 ± 0.69 14.87 ± 0.79
PCL/PLA-10 / / 11.41 ± 0.55 / / 9.13 ± 0.63 / / 12.38 ± 0.59
PCL/PLA-20 / / 20.44 ± 0.23 / / 18.87 ± 0.56 / / 13.32 ± 0.61
PCL/PLA-25 / / 26.30 ± 1.01 / / 24.09 ± 0.78 / / 15.34 ± 0.71
PCL/PLA-30 / / 31.48 ± 1.27 / / 27.85 ± 0.88 / / 14.29 ± 0.76
The 3D-printed master moulds and PDMS moulds are the same for both PCL and PCL/PLA groups.
both large (95 × 71 µm) and small (10 × 7 µm) scan areas decreased after they are blended. TGA and derivative
(Figure 3b). The PDMS moulds were not able to be assessed thermogravimetric analysis were additionally assessed to
using LSCM due to the optical transparency. This revealed understand the thermal degradation behaviour (Figure S4
that the 3D-printed master moulds had significantly lower in Supplementary File).
surface roughness (root mean square height area roughness, The crystallinity data indicate that PCL is highly
Sq: ~90.9 nm; arithmetical mean height area roughness, crystalline (X ~55%), whilst PLA has a considerably
Sa: ~68.6 nm) than the microgrooved films (Sq: ~371.4 lower crystallinity (X ~25%). Increasing the polymer
c
nm, Sa: ~248.1 nm) (Figure 3b-ii and 3b-iii). The PDMS concentration for both PCL and PLA resulted in a slight
c
moulds appear smooth, although further quantitative
verification is required. The subsequent microgroove increase in crystallinity. The PCL/PLA blend showed a
pattern transfers from the original 3D-printed master slight decrease in crystallinity of the PCL phase, but the
mould to the PDMS mould, and finally, the polymer film PLA phase increases in crystallinity considerably. This
introduces a considerable amount of surface roughness. observation is similar to a previous study by Carmona et
50
al. as the PLA limits the mobility of PCL chains, whereas
The PCL films had an average mean surface roughness, PCL provides additional mobility to the PLA chains.
Sa, of 331.83 nm, which was higher than PCL/PLA of
167.65 nm. The PCL microgroove films have a consistent Crystallinity has a significant impact on the
surface roughness even with different microgroove sizes. mechanical, degradation, and biological properties of
However, the PCL/PLA-25 and 30 groove sizes (Sa: ~118.3 thermoplastics. Increasing crystallinity tends to improve
nm) showed a lower roughness than the PCL/PLA-10 stiffness and tensile strength, whereas the amorphous
51
and 20 (Sa: ~217 nm). A similar trend is observed for Sq. phase absorbs more impact energy. During degradation
Surface measurements including skewness (Ssk), kurtosis of polymers, the amorphous phase is preferentially
(Sku), and maximum peak, pit depth, and height are shown degraded. 52,53 Subsequently, polymer crystallinity is
in Table S3. All the moulds and microgroove films have an essential in tuning material properties for specific tissue
Ssk close to 0 and are generally positive, indicating a height engineering applications.
distribution close to the mean surface plane with peaks. 3.4. Tensile properties of microgroove films
The Sku is predominately below 3, representing a lack of The mechanical properties of the microgroove film with
high peaks or deep valleys.
different topographical designs, thickness (10, 20, and 30
3.3. Thermal evaluation µm), and concentrations (1, 3, and 5 wt%) were assessed
DSC was used to assess the thermal and crystallisation using tensile testing (Figure 5). The PCL films had a
properties of PCL, PLA, and the PCL/PLA blend with significantly higher tensile strength (~18.1 MPa) and
different concentrations (1, 3, and 5 wt%) (Figure 4 and maximum strain (~4.3 mm/mm) in comparison to the
Table 2). The T of PCL/PLA blend is consistently slightly PCL/PLA films (~12.4 MPa, ~0.15 mm/mm). The PCL/
m
lower than PCL and PLA at the same concentration, PLA films had a higher Young’s modulus (~109.6 MPa)
which can be seen clearly with the shift in the DSC than the PCL films (~56.7 MPa), indicating the increased
curves (dotted lines). The ΔH for PCL and PLA are both stiffness and deformation-resistant properties of PCL/PLA
m
Volume 10 Issue 3 (2024) 496 doi: 10.36922/ijb.2725