
Page 80 - IJB-4-1
P. 80
Liang H, et al.
(A) (B) (E)
(C) (D)
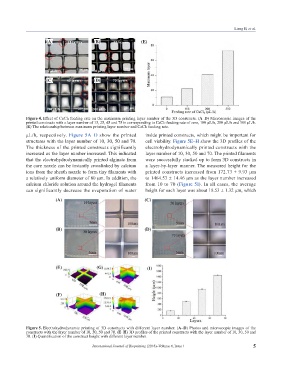
Figure 4. Effect of CaCl2 feeding rate on the maximum printing layer number of the 3D constructs. (A–D) Microscopic images of the
printed constructs with a layer number of 13, 25, 45 and 75 in corresponding to CaCl2 feeding rate of zero, 100 μL/h, 200 μL/h and 300 μL/h.
(E) The relationship between maximum printing layer number and CaCl2 feeding rate.
μL/h, respectively. Figure 5A–D show the printed inside printed constructs, which might be important for
structures with the layer number of 10, 30, 50 and 70. cell viability. Figure 5E–H show the 3D profiles of the
The thickness of the printed constructs significantly electrohydrodynamically printed constructs with the
increased as the layer number increased. This indicated layer number of 10, 30, 50 and 70. The printed filaments
that the electrohydrodynamically printed alginate from were successfully stacked up to form 3D constructs in
the core nozzle can be instantly crosslinked by calcium a layer-by-layer manner. The measured height for the
ions from the sheath nozzle to form tiny filaments with printed constructs increased from 172.73 ± 9.93 μm
a relatively uniform diameter of 80 μm. In addition, the to 1464.53 ± 14.46 μm as the layer number increased
calcium chloride solution around the hydrogel filaments from 10 to 70 (Figure 5I). In all cases, the average
can significantly decrease the evaporation of water height for each layer was about 18.53 ± 1.32 μm, which
(A) (C)
(B) (D)
(E) (G) (I)
(F) (H)
Figure 5. Electrohydrodynamic printing of 3D constructs with different layer number. (A–D) Photos and microscopic images of the
constructs with the layer number of 10, 30, 50 and 70. (E–H) 3D profiles of the printed constructs with the layer number of 10, 30, 50 and
70. (I) Quantification of the construct height with different layer number.
International Journal of Bioprinting (2018)–Volume 4, Issue 1 5