
Page 69 - IJB-4-2
P. 69
Novel ultrashort self-assembling peptide bioinks for 3D culture of muscle myoblast cells
2.5.5 Cytoskeletal Staining 02 was used so that it can be extruded from the printing
nozzle. In case of lower concentrations of peptides (3
The morphology of mouse myoblast cells was studied mg/mL or 4 mg/mL), we were unable to print due to the
at each time point using immunofluorescence staining. low viscosity of the peptides at these concentrations.
In brief, the cells were fixed in 4% paraformaldehyde Two different structures circle (8 mm diameter) and
for 30 min. After the incubation, the cells were washed square (6 × 6 mm ) were printed in a layer-by-layer
2
three times using DPBS. The cell membrane was fashion. The nozzle diameter was 400 µm, and an air
permeabilized by incubating for 10 min in ice-cold pressure of 12 KPa with a printing speed of 4 mm/sec
permeabilization buffer (300 mM sucrose, 3 mM MgCl , was used for the peptide printing. Finally, 2× PBS buffer
2
and 0.5% Triton X-100 in PBS solution). This solution was added on top of the ring or square structure to form
was replaced with blocking buffer solution (5% FBS,
0.1% Tween-20, and 0.02% sodium azide in PBS) for 30 the peptide hydrogel.
min. The permeabilized cells were then stained with anti- 2.7 Statistical Analysis
vinculin (1:300) for 1 h, then with anti-mouse IgG-FITC
and rhodamine-phalloidin (1:300) for 1 h at 37 °C. After All the results are presented as a mean ± SD. Three
that, DAPI staining (1:100 water) was used to stain the similar experiments were performed independently
nucleus for 5 min . Fluorescence confocal microscopy for each type of test. One-way analysis of variance
[33]
(Zeiss LSM 710 Inverted Confocal Microscope, determined statistical differences among the
Germany) was used to observe the cell morphology. experimental groups. When the P-values were P < 0.05,
the results were considered to be statistically significant.
2.5.6 Analysis of Myoblast Alignment
3. 3. Results
The alignment of myoblast cells within different
scaffolds was determined using Fast Fourier transform 3.1 SEM Analysis of Peptide Hydrogels
(FFT) of fluorescence confocal image which shows
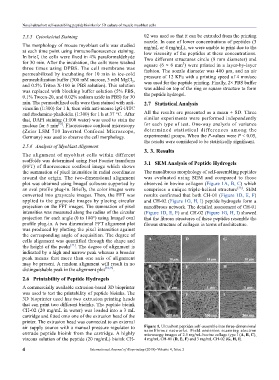
the summation of pixel intensities in radial coordinates The nanofibrous morphology of self-assembling peptides
around the origin. The two-dimensional alignment was evaluated using SEM and compared to those
plot was obtained using ImageJ software supported by observed in bovine collagen (Figure 1A, B, C) which
an oval profile plug-in. Briefly, the color images were comprises a unique triple-helical structure [36] . SEM
converted into grayscale images. Then, the FFT was results confirmed that both CH-01 (Figure 1D, E, F)
applied to the grayscale images by placing circular and CH-02 (Figure 1G, H, I) peptide hydrogels form a
projection on the FFT images. The summation of pixel nanofibrous network. The detailed assessment of CH-01
intensities was measured along the radius of the circular (Figure 1D, E, F) and CH-02 (Figure 1G, H, I) showed
projection for each angle (0 to 180°) using ImageJ oval that the fibrous structures of these peptides resemble the
profile plug-in. A two dimensional FFT alignment plot fibrous structure of collagen in terms of architecture.
was produced by plotting the pixel intensities against
the corresponding angle of acquisition. The degree of
cells alignment was quantified through the shape and
the height of the peaks [34] . The degree of alignment is
indicated by a high and narrow peak whereas a broader
peak means that more than one axis of alignment
may be present. A random alignment will result in no
distinguishable peak in the alignment plot [34,35] .
2.6 Printability of Peptide Hydrogels
A commercially available extrusion-based 3D bioprinter
was used to test the printability of peptide bioinks. The
3D bioprinter used has two extrusion printing heads
that can print two different bioinks. The peptide bioink
CH-02 (20 mg/mL in water) was loaded into a 3 mL
cartridge and fitted onto one of the extrusion head of the
printer. The extrusion head was connected to an external
air supply source with a manual pressure regulator to Figure 1. Ultrashort peptides self-assemble into three-dimensional
nanofibrous networks. Field emission scanning electron
extrude peptide bioink from the cartridge. A highly microscopy images of 2.5 mg/mL bovine collage type I (A, B, C),
viscous solution of the peptide (20 mg/mL) bioink CH- 4 mg/mL CH-01 (D, E, F) and 3 mg/mL CH-02 (G, H, I).
4 International Journal of Bioprinting (2018)–Volume 4, Issue 2