
Page 347 - IJB-10-4
P. 347
International Journal of Bioprinting Stiffness of scaffold-mediated immune response
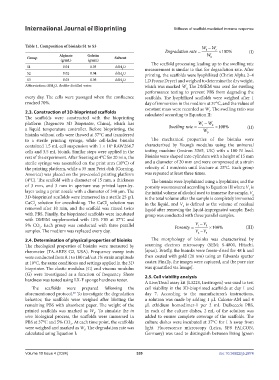
Table 1. Composition of bioinks S1 to S3 W W
Degradationrate 0 t 100% (I)
Alginate Gelatin W
Group Solvent 0
(g/mL) (g/mL)
S1 0.01 0.03 ddH O The scaffold processing leading up to the swelling rate
2 measurement is similar to that for degradation rate. After
S2 0.02 0.04 ddH O
2 printing, the scaffolds were lyophilized (Christ Alpha 2–4
S3 0.03 0.05 ddH O LD Freeze Dryer) and weighed to determine the dry weight,
2
Abbreviation: ddH O, double-distilled water. which was marked W The DMEM was used for swelling
2 0.
performance testing to prevent PBS from degrading the
every day. The cells were passaged when the confluence scaffolds. The lyophilized scaffolds were weighed after 1
reached 70%. day of immersion in the medium at 37°C, and the values of
constant mass were recorded as W . The swelling ratio was
2.3. Construction of 3D-bioprinted scaffolds calculated according to Equation II:
t
The scaffolds were constructed with the bioprinting
platform (Regenovo 3D Bioprinter, China), which has Swelling rate W W 0 100%
t
a liquid temperature controller. Before bioprinting, the W (II)
bioinks without cells were thawed at 37°C and transferred 0
to a sterile printing syringe, while cell-laden bioinks The mechanical properties of the bioinks were
contained 1.5 mL cell suspension with 1 × 10 RAW264.7 characterized by Young’s modulus using the universal
6
cells and 3.5 mL bioink. Similar steps were applied in the testing machine (Instron 3365, UK) with a 100 N load.
rest of the experiment. After freezing at 4°C for 20 min, the Bioinks were shaped into cylinders with a height of 15 mm
sterile syringe was assembled on the print arm (10°C) of and a diameter of 20 mm and were compressed at a strain
the printing platform, while a 35 mm Petri dish (Corning, velocity of 1 mm/min until fracture at 25°C. Each group
America) was placed on the pre-cooled printing platform was repeated at least three times.
(4°C). The scaffold with a diameter of 15 mm, a thickness The bioinks were lyophilized using a lyophilizer, and the
of 3 mm, and 3 mm in aperture was printed layer-by- porosity was measured according to Equation III where V is
1
layer using a print nozzle with a diameter of 340 μm. The the initial volume of alcohol used to immerse the sample, V
2
3D-bioprinted scaffolds were immersed in a sterile 25 g/L is the total volume after the sample is completely immersed
CaCl solution for crosslinking. The CaCl solution was in the liquid, and V is defined as the volume of residual
2
2
3
removed after 10 min, and the scaffold was rinsed twice liquid after removing the liquid-impregnated sample. Each
with PBS. Finally, the bioprinted scaffolds were incubated group was conducted with three parallel samples.
with DMEM supplemented with 10% FBS at 37°C and
5% CO . Each group was conducted with three parallel Porosity V V 3 100% (III)
1
2
samples. The medium was replaced every day. V V 3
2
2.4. Determination of physical properties of bioinks The morphology of bioinks was characterized by
The rheological properties of bioinks were measured by scanning electron microscopy (SEM; S-4800, Hitachi,
rheometer (TA-ARES G2, USA). Frequency sweep tests Japan). Briefly, the bioinks were freeze-dried for 48 h and
were conducted from 0.1 to 100 rad/s at 1% strain amplitude then coated with gold (20 nm) using an Edwards sputter
at 10°C, the same conditions and settings applied in the 3D coater. Finally, the images were captured, and the pore size
bioprinter. The elastic modulus (G) and viscous modulus was quantified via ImageJ.
(G) were investigated as a function of frequency. Shore 2.5. Cell viability analysis
hardness was tested using LX-F sponge hardness tester.
A Live/Dead assay kit (L3224, Invitrogen) was used to test
The scaffolds were prepared following the cell viability in the 3D-bioprinted scaffolds at day 1 and
aforementioned protocol. To investigate the degradation day 7. According to the manufacturer’s instructions,
29
behavior, the scaffolds were weighed after blotting the a solution was made by adding 1 μL Calcein-AM and 4
remaining PBS with absorbent paper. The weight of the μL ethidium homodimer-1 per 2 mL Dulbecco’s PBS.
printed scaffolds was marked as W . To simulate the in In each of the culture dishes, 2 mL of the solution was
0
vivo biological process, the scaffolds were immersed in added to ensure complete coverage of the scaffolds. The
PBS at 37°C and 5% CO . At each time point, the scaffolds culture dishes were incubated at 37°C for 1 h away from
2
were weighed and marked as W . The degradation rate was light. Fluorescence microscopy (Leica, SP8 FALCON,
t
calculated using Equation I: Germany) was used to distinguish between living (green
Volume 10 Issue 4 (2024) 339 doi: 10.36922/ijb.2874