
Page 349 - IJB-10-4
P. 349
International Journal of Bioprinting Stiffness of scaffold-mediated immune response
3.2. Printability and biocompatibility of scaffold S3 did not completely degrade at 60 h. Meanwhile,
macrophage-laden bioinks with different stiffness there was a significant difference among the swelling rates
The RAW264.7 cells (macrophage) at a concentration of the three scaffolds when immersed in DMEM for 24 h
of 1 × 10 /mL were mixed into the bioinks S1 to S3 and (P < 0.05, Figure 2C). The swelling rate of the scaffold
6
bioprinted into scaffolds (named scaffolds S1, S2, and S3). increased with the increase of stiffness. The swelling rate
All macrophage-laden bioinks had good printability and of scaffold S3 was the highest and reached 4.19%. The Live/
Dead assay was performed to investigate the viability of
shape maintenance (Figure 2A). 3D-bioprinted scaffolds the RAW264.7 cells seeded in the scaffolds. The cells in
S1, S2, and S3 showed different speeds of degradation when scaffolds were uniform (Figure 2D). As shown in Figure 2G,
immersed in DMEM (Figure 2B). The scaffold S1 completely the viability of cells encapsulated in scaffolds was all above
degraded at 36 h, displaying the fastest degradation rate. The 80% during the 7 days’ in vitro culture after bioprinting.
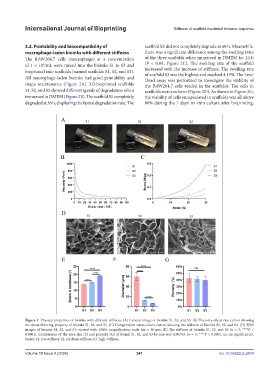
Figure 1. Physical properties of bioinks with different stiffness. (A) General image of bioinks S1, S2, and S3. (B) Viscosity–shear rate curves showing
the shear-thinning property of bioinks S1, S2, and S3. (C) Compression stress–strain curves showing the stiffness of bioinks S1, S2, and S3. (D) SEM
images of bioinks S1, S2, and S3; viewed with 1000× magnification; scale bar = 50 μm. (E) The stiffness of bioinks S1, S2, and S3 (n = 3, ****P <
0.0001). Comparison of the pore size (F) and porosity (G) of bioink S1, S2, and S3 by one-way ANOVA (n = 3, ****P < 0.0001, ns: no significance).
Notes: S1, low stiffness; S2, medium stiffness; S3, high stiffness.
Volume 10 Issue 4 (2024) 341 doi: 10.36922/ijb.2874