
Page 356 - IJB-10-4
P. 356
International Journal of Bioprinting Stiffness of scaffold-mediated immune response
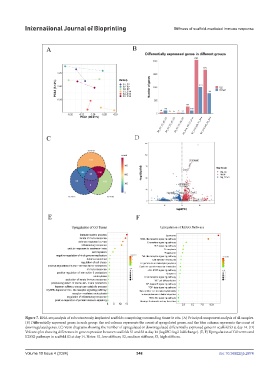
Figure 7. RNA-seq analysis of subcutaneously implanted scaffolds comprising surrounding tissue in situ. (A) Principal component analysis of all samples.
(B) Differentially expressed genes in each group: the red column represents the count of upregulated genes, and the blue column represents the count of
downregulated genes. (C) Venn diagrams showing the number of upregulated or downregulated differentially expressed genes in scaffold S3 at day 14. (D)
Volcano plot showing differences in gene expression between scaffolds S1 and S3 at day 14 (log2FC: log2 fold change). (E, F) Upregulation of GO terms and
KEGG pathways in scaffold S3 at day 14. Notes: S1, low stiffness; S2, medium stiffness; S3, high stiffness.
Volume 10 Issue 4 (2024) 348 doi: 10.36922/ijb.2874