
Page 380 - IJB-10-5
P. 380
International Journal of Bioprinting Tunable anisotropic gyroid bioscaffolds
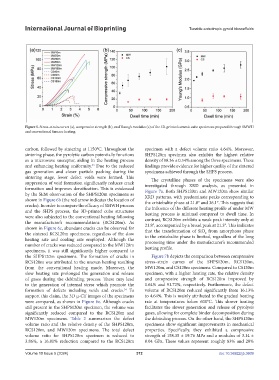
Figure 5. Stress–strain curves (a), compressive strength (b), and Young’s modulus (c) of the 3D-printed ceramic cube specimens prepared through SMWH
and conventional furnace heating.
carbon, followed by sintering at 1150°C. Throughout the specimen with a defect volume ratio 4.64%. Moreover,
sintering phase, the pyrolytic carbon potentially functions SHPS120m specimen also exhibits the highest relative
as a microwave susceptor, aiding in the heating process density of 98.36 ± 0.54% among the three specimens. These
and enhancing heating uniformity. Due to the reduced findings provide evidence for higher quality of the sintered
33
gas generation and closer particle packing during the specimens achieved through the SHPS process.
sintering stage, fewer defect voids were formed. This The crystalline phases of the specimens were also
suppression of void formation significantly reduces crack investigated through XRD analysis, as presented in
formation and improves densification. This is evidenced Figure 7a. Both SHPS120m and MW120m show similar
by the SEM observation of the SHPS120m specimens as XRD patterns, with predominate peaks corresponding to
shown in Figure 6b (the red arrow indicates the location of the cristobalite phase at 21.8° and 36.1°. This suggests that
cracks). In order to compare the efficacy of SMWH process the influence of the different heating profile of under MW
and the SHPS process, the 3D-printed cube structures heating process is minimal compared to dwell time. In
were also subjected to the conventional heating following contrast, RCS120m exhibits a weak peak intensity only at
the manufacturer’s recommendations (RCS120m). As 21.8°, accompanied by a broad peak at 21.3°. This indicates
shown in Figure 6c, abundant cracks can be observed for that the transformation of SiO from amorphous phase
the sintered RCS120m specimens, regardless of the slow to the cristobalite phase is limited, regardless of the long
2
heating rate and cooling rate employed. Although the processing time under the manufacturer’s recommended
number of cracks was reduced compared to the MW120m heating profile.
specimens, it was still significantly higher compared to
the SHPS120m specimens. The formation of cracks in Figure 7b depicts the comparison between compressive
RCS120m was attributed to the uneven heating resulting stress–strain curves of the SHPS120m, RCS120m,
from the conventional heating mode. Moreover, the MW120m, and CS120m specimens. Compared to CS120m
slow heating rate prolonged the generation and release specimen, with a higher heating rate, the relative density
of gases during the debinding process. These may lead and compressive strength of RCS120m improved by
to the generation of internal stress which promote the 1.64% and 91.72%, respectively. Furthermore, the defect
formation of defects including voids and cracks. To volume of RCS120m reduced significantly from 16.13%
34
support this claim, the 3D µ-CT images of the specimens to 4.64%. This is mainly attributed to the gradual heating
were compared, as shown in Figure 6e. Although cracks rate at temperatures below 600°C. This slower heating
still present in the SHPS120m specimen, the volume was facilitates the slower generation and release of pyrolysis
significantly reduced compared to the RCS120m and gases, allowing for complete binder decomposition during
MW120m specimens. Table 2 summarizes the defect the debinding process. On the other hand, the SHPS120m
volume ratio and the relative density of the SHPS120m, specimens show significant improvements in mechanical
RCS120m, and MW120m specimens. The total defect properties. Specifically, they exhibited a compressive
volume ratio for SHPS120m specimen is reduced to strength of 158.35 ± 19.76 MPa and a modulus of 3.14 ±
3.86%, a 16.81% reduction compared to the RCS120m 0.04 GPa. These values represent roughly 83% and 20%
Volume 10 Issue 5 (2024) 372 doi: 10.36922/ijb.3609