
Page 385 - IJB-10-5
P. 385
International Journal of Bioprinting Tunable anisotropic gyroid bioscaffolds
ratio of the unit cell and the compressive strength of the 3.5. In vitro study
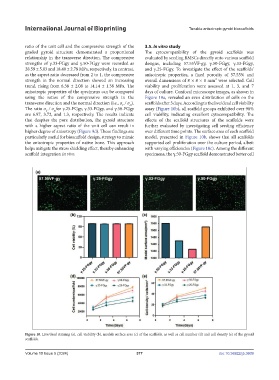
graded gyroid structure demonstrated a proportional The cytocompatibility of the gyroid scaffolds was
relationship in the transverse direction. The compressive evaluated by seeding BMSCs directly onto various scaffold
strengths of γ.33-FGgy and γ.50-FGgy were recorded as designs, including 57.55VF-gy, γ.50-FGgy, γ.33-FGgy,
28.59 ± 5.83 and 18.40 ± 2.78 MPa, respectively. In contrast, and γ.25-FGgy. To investigate the effect of the scaffolds’
as the aspect ratio decreased from 2 to 1, the compressive anisotropic properties, a fixed porosity of 57.55% and
strength in the normal direction showed an increasing overall dimensions of 8 × 8 × 8 mm³ were selected. Cell
trend, rising from 6.38 ± 2.08 to 14.14 ± 1.38 MPa. The viability and proliferation were assessed at 1, 3, and 7
anisotropic properties of the specimens can be compared days of culture. Confocal microscope images, as shown in
using the ratios of the compressive strength in the Figure 10a, revealed an even distribution of cells on the
transverse direction and the normal direction (i.e., σ / σ ). scaffolds after 3 days. According to the live/dead cell viability
N
T
The ratio σ / σ for γ.25-FGgy, γ.33-FGgy, and γ.50-FGgy assay (Figure 10b), all scaffold groups exhibited over 98%
T
N
are 6.97, 3.72, and 1.3, respectively. The results indicate cell viability, indicating excellent cytocompatibility. The
that despites the pore distribution, the gyroid structure effects of the scaffold structures of the scaffolds were
with a higher aspect ratio of the unit cell can result in further evaluated by investigating cell seeding efficiency
higher degree of anisotropy (Figure 9d). These findings are over different time points. The surface area of each scaffold
particularly useful for bioscaffold design, strategy to mimic model, presented in Figure 10b, shows that all scaffolds
the anisotropic properties of native bone. This approach supported cell proliferation over the culture period, albeit
helps mitigate the stress shielding effect, thereby enhancing with varying efficiencies (Figure 10c). Among the different
scaffold integration in vivo. specimens, the γ.50-FGgy scaffold demonstrated better cell
Figure 10. Live/dead staining (a), cell viability (b), models surface area (c) of the scaffolds, as well as cell number (d) and cell density (e) of the gyroid
scaffolds.
Volume 10 Issue 5 (2024) 377 doi: 10.36922/ijb.3609