
Page 491 - IJB-10-5
P. 491
International Journal of Bioprinting Biocompatible 3D-printed radiotherapy spacer
(ALFAMIRAGE, MD-300S) in accordance with ASTM 3.2. Dosimetric comparison with and without spacer
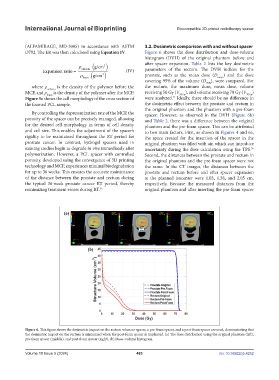
D792. The ER was then calculated using Equation IV. Figure 6 shows the dose distribution and dose-volume
histogram (DVH) of the original phantom before and
g/cm )
ρ unfoam ( 3 after spacer expansion. Table 2 lists the key dosimetric
Expansion ratio = (IV) parameters of the rectum. The DVH indices for the
g/cm )
ρ foam ( 3 prostate, such as the mean dose (D mean ) and the dose
covering 95% of the volume (D 95% ), were compared. For
where ρ unfoam is the density of the polymer before the the rectum, the maximum dose, mean dose, volume
MCP, and ρ foam is the density of the polymer after the MCP. receiving 50 Gy (V 50Gy ), and volume receiving 70 Gy (V 70Gy )
32
Figure 5c shows the cell morphology of the cross section of were analyzed. Ideally, there should be no difference in
the foamed PCL sample. the dosimetric effect between the prostate and rectum in
the original phantom and the phantom with a pre-foam
By controlling the depressurization rate of the MCP, the spacer. However, as observed in the DVH (Figure 6b)
porosity of the spacer can be precisely managed, allowing and Table 2, there was a difference between the original
for the desired cell morphology in terms of cell density phantom and the pre-foam spacer. This can be attributed
and cell size. This enables the adjustment of the spacer’s to two main factors. First, as shown in Figures 4 and 6a,
rigidity to be maintained throughout the RT period for the space created for the insertion of the spacer in the
prostate cancer. In contrast, hydrogel spacers used in original phantom was filled with air, which can introduce
existing studies begin to degrade in vivo immediately after uncertainty during the dose calculation using the TPS.
36
polymerization. However, a PCL spacer with controlled Second, the distances between the prostate and rectum in
porosity, developed using the convergence of 3D printing the original phantom and the pre-foam spacer were not
technology and MCP, experiences minimal biodegradation the same. In the CT images, the distances between the
for up to 36 weeks. This ensures the accurate maintenance prostate and rectum before and after spacer expansion
of the distance between the prostate and rectum during at the planned isocenter were 1.03, 1.38, and 2.05 cm,
the typical 36-week prostate cancer RT period, thereby respectively. Because the measured distances from the
minimizing treatment errors during RT. 35 original phantom and after inserting the pre-foam spacer
Figure 6. This figure shows the dosimetric impact on the rectum when no spacer, a pre-foam spacer, and a post-foam spacer are used, demonstrating that
the dosimetric impact on the rectum is minimized when the post-foam spacer is implanted. (a) The dose distribution using the original phantom (left),
pre-foam spacer (middle), and post-foam spacer (right). (b) Dose–volume histogram.
Volume 10 Issue 5 (2024) 483 doi: 10.36922/ijb.4252