
Page 489 - IJB-10-5
P. 489
International Journal of Bioprinting Biocompatible 3D-printed radiotherapy spacer
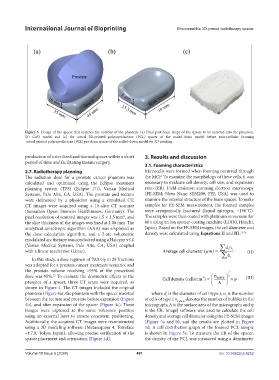
Figure 3. Design of the spacer that matches the contour of the phantom. (a) Final post-foam shape of the spacer to be inserted into the phantom.
(b) CAD model and (c) the actual 3D-printed polycaprolactone (PCL) spacer of the scaled-down model before microcellular foaming
actual printed polycaprolactone (PCL) pre-foam spacer of the scaled-down model for 3D printing.
production of a sterilized and foamed spacer within a short 3. Results and discussion
period of time and facilitating instant surgery.
3.1. Foaming characteristics
2.7. Radiotherapy planning Microcells were formed when foaming occurred through
The radiation dose for a prostate cancer phantom was the MCP. To examine the morphology of these cells, it was
calculated and optimized using the Eclipse treatment necessary to evaluate cell density, cell size, and expansion
planning system (TPS) (Eclipse 17.0, Varian Medical ratio (ER). Field-emission scanning electron microscopy
Systems, Palo Alto, CA, USA). The prostate and rectum (FE-SEM; Nova Nano SEM200, FEI, USA) was used to
were delineated by a physician using a simulated CT. examine the internal structure of the foam spacer. To make
CT images were acquired using a 16-slice CT scanner samples for FE-SEM measurement, the foamed samples
(Sensation Open; Siemens Healthineers, Germany). The were cryogenically fractured (liquid nitrogen, −196˚C).
2
pixel resolution of scanned images was 1.5 × 1.5 mm , and The samples were then coated with platinum in vacuum for
the slice thickness of the images was fixed at 1.00 mm. The 60 s using an ion sputter-coating machine (E1030, Hitachi,
analytical anisotropic algorithm (AAA) was employed as Japan). Based on the FE-SEM images, the cell diameter and
the dose calculation algorithm, and a 2-arc volumetric density were calculated using Equations II and III. 33,34
modulated arc therapy was conducted using a Halcyon v3.0
(Varian Medical Systems, Palo Alto, CA, USA) coupled ∑ dn
with a linear accelerator (Linac). Average cell diameter ( m) = µ ∑ n i i (II)
In this study, a dose regimen of 70.0 Gy in 28 fractions i
was adopted for a prostate cancer treatment scenario, and
the prostate volume receiving >95% of the prescribed 3
32
dose was 95%. To evaluate the dosimetric effects in the Cell density (cells/cm) = n bubble 2 ×ψ (III)
3
presence of a spacer, three CT scans were acquired, as A
shown in Figure 4. The CT images included the original
phantom (Figure 4a), the phantom with the spacer inserted where d is the diameter of cell-type i; n is the number
i
i
between the rectum and prostate before expansion (Figure of cells of type i; n bubble denotes the number of bubbles in the
4b), and after expansion of the spacer (Figure 4c). These micrograph; A is the surface area of the micrograph; and ψ
images were captured at the same reference position is the ER. ImageJ software was used to calculate the cell
using an external laser to ensure consistent positioning. density and average cell diameter using the FE-SEM images
Additionally, the acquired CT images were reconstructed (Figure 5a and b), and the results are plotted in Figure
using a 3D modeling software (Metasequoia 4, Tetraface 5d. A cell distribution graph of the foamed PCL sample
v4.7.0, Tokyo, Japan), allowing precise verification of the is shown in Figure 5e. To measure the ER of the spacer,
spacer placement and orientation (Figure 4d). the density of the PCL was measured using a densimeter
Volume 10 Issue 5 (2024) 481 doi: 10.36922/ijb.4252