
Page 520 - IJB-10-5
P. 520
International Journal of Bioprinting 3D model of neurogenesis in Alzheimer’s disease
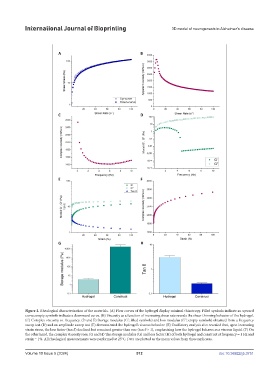
Figure 2. Rheological characterization of the materials. (A) Flow curves of the hydrogel display minimal thixotropy. Filled symbols indicate an upward
curve; empty symbols indicate a downward curve. (B) Viscosity as a function of increasing shear rate reveals the shear-thinning behavior of the hydrogel.
(C) Complex viscosity vs. frequency. (D and E) Storage modulus (G’; filled symbols) and loss modulus (G”; empty symbols) obtained from a frequency
sweep test (D) and an amplitude sweep test (E) demonstrated the hydrogel’s viscous behavior. (E) Oscillatory analysis also revealed that, upon increasing
strain stress, the loss factor (tan δ) declined but remained greater than one (tan δ > 1), emphasizing how the hydrogel behaves as a viscous liquid. (F) On
the other hand, the complex viscosity rose. (G and H) The storage modulus (G) and loss factor (H) of both hydrogel and construct at frequency = 1 Hz and
strain = 1%. All rheological measurements were performed at 25°C. Data are plotted as the mean values from three replicates.
Volume 10 Issue 5 (2024) 512 doi: 10.36922/ijb.3751