
Page 523 - IJB-10-5
P. 523
International Journal of Bioprinting 3D model of neurogenesis in Alzheimer’s disease
bioprinted in the absence of Aβ oligomers increased up to 95% of AD cases are sporadic instead of familial, 98,99 and in
eight days after bioprinting (p < 0.0001; day 8 vs. day 0 vitro models for this form of AD are scarce.
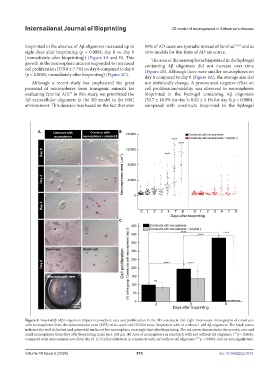
[immediately after bioprinting]) (Figure 4A and B). This The area of the neurospheres bioprinted in the hydrogel
growth in the neurosphere area corresponded to increased containing Aβ oligomers did not increase over time
cell proliferation (379.8 ± 7.7%) on day 8 compared to day 0 (Figure 4B). Although there were smaller neurospheres on
(p < 0.0001; immediately after bioprinting) (Figure 4C). day 8 compared to day 0 (Figure 4A), the average size did
Although a recent study has emphasized the great not statistically change. A pronounced negative effect on
potential of neurospheres from transgenic animals for cell proliferation/viability was observed in neurospheres
evaluating familial AD, in this study, we prioritized the bioprinted in the hydrogel containing Aβ oligomers
97
Aβ extracellular oligomers in the 3D model in the NSC (52.7 ± 16.5% for day 3; 8.02 ± 3.1% for day 8; p < 0.0001,
environment. This decision was based on the fact that over compared with constructs bioprinted in the hydrogel
Figure 4. Amyloid β (Aβ) oligomers impact neurosphere area and proliferation in the 3D constructs. (A) Light microscope micrographs of constructs
with neurospheres from the subventricular zone (SVZ) of six-week-old C57bl/6 mice, bioprinted with or without 1 µM Aβ oligomers. The black arrow
indicates the well-delimited and spheroidal surface of the neurosphere, even eight days after bioprinting. The red arrow demonstrates the necrotic core and
small neurospheres three days after bioprinting. Scale bars: 100 μm. (B) Area of neurospheres in constructs with and without Aβ oligomers ( p < 0.0001,
****
compared with neurospheres area from day 0). (C) Cell proliferation in constructs with and without Aβ oligomers (**** p < 0.0001; and ns: non-significant).
Volume 10 Issue 5 (2024) 515 doi: 10.36922/ijb.3751