
Page 52 - IJB-6-1
P. 52
HRP plus glucose-mediated bioprinting
3.2 Cell behavior in the printed construct cells by printing with the proposed cross-linking
method. Moreover, the printed construct stably
To ensure the feasibility of applying the proposed maintained its shape and dimension even after
bioink and cross-linking method for printing living 7 days of culture in the presence of cells. The cell
cells, the cell-laden lattice-shaped constructs were viability in the construct (56.0 ± 2.4%, n = 3) at
prepared. Mouse 10T1/2 fibroblasts were chosen as day 7 was found to be higher than that in the non-
a model cell line for the cell studies. As non-printed printed hydrogel (44.3 ± 2.5%, n=3). The reason
hydrogels for comparison, the hydrogels were of this difference in cell viability may be due to the
prepared in cell culture well plate using the same different internal architecture of the printed and
bioink. As shown in Figure 5, the homogeneous non-printed bulk hydrogel. It was reported that
distributions of viable cells were observed in the internal geometrical features of cell enclosed
both non-printed (50.1 ± 0.4% viability, n=3) and hydrogel have influence on cell fate . However,
[41]
printed hydrogels (54.1 ± 0.6% viability, n=3) the decreases of cell density in both hydrogels
after 1 day of culture. These similar cell viabilities were observed. This is most likely attributed to
indicate that there were no harmful effects on the the dead cells that were not stained due to the cell
A
Day 0 Day 4 Day 8
B 1.3
0 (-) 1.2
Diameter / Diameterday 1.1
1
0.9
0.8
0 2 4 6 8 10
Soaking time (day)
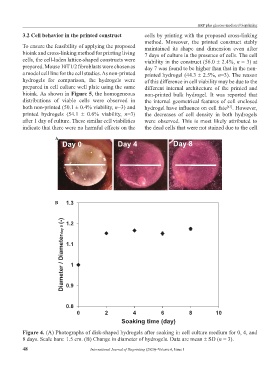
Figure 4. (A) Photographs of disk-shaped hydrogels after soaking in cell culture medium for 0, 4, and
8 days. Scale bars: 1.5 cm. (B) Change in diameter of hydrogels. Data are mean ± SD (n = 3).
48 International Journal of Bioprinting (2020)–Volume 6, Issue 1