
Page 27 - IJB-6-2
P. 27
Zolfagharian, et al.
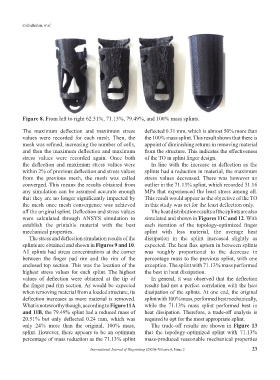
Figure 8. From left to right 62.51%, 71.13%, 79.49%, and 100% mass splints.
The maximum deflection and maximum stress deflected 0.31 mm, which is almost 50% more than
values were recorded for each mesh. Then, the the 100% mass splint. This result shows that there is
mesh was refined, increasing the number of cells, appoint of diminishing returns in removing material
and then the maximum deflection and maximum from the structure. This indicates the effectiveness
stress values were recorded again. Once both of the TO in splint finger design.
the deflection and maximum stress values were In line with the increase in deflection as the
within 2% of previous deflection and stress values splints had a reduction in material, the maximum
from the previous mesh, the mesh was called stress values decreased. There was however an
converged. This means the results obtained from outlier in the 71.13% splint, which recorded 31.16
any simulation can be assumed accurate enough MPa that experienced the least stress among all.
that they are no longer significantly impacted by This result would appear as the objective of the TO
the mesh once mesh convergence was achieved in this study was set for the least deflection only.
off the original splint. Deflection and stress values The heat distribution results of the splints are also
were calculated through ANSYS simulation to simulated and shown in Figures 11C and 12. With
establish the printable material with the best each iteration of the topology-optimized finger
mechanical properties. splint with less material, the average heat
The stress and deflection simulation results of the dissipation in the splint increased slightly as
splints are obtained and shown in Figures 9 and 10. expected. The heat flux upturn in between splints
All splints had stress concentrations at the corner was roughly proportional to the decrease in
between the finger pad rim and the rim of the percentage mass to the previous splint, with one
enclosed top section. This was the location of the exception. The splint with 71.13% mass performed
highest stress values for each splint. The highest the best in heat dissipation.
values of deflection were obtained at the tip of In general, it was observed that the deflection
the finger pad rim section. As would be expected results had not a perfect correlation with the heat
when removing material from a loaded structure, its dissipation of the splints. At one end, the original
deflection increases as more material is removed. splint with 100% mass, performed best mechanically,
What is noteworthy though, according to Figure 11A while the 71.13% mass splint performed best in
and 11B, the 79.49% splint had a reduced mass of heat dissipation. Therefore, a trade-off analysis is
20.51% but only deflected 0.24 mm, which was required to opt for the most appropriate splint.
only 24% more than the original, 100% mass, The trade-off results are shown in Figure 13
splint. However, there appears to be an optimum that the topology-optimized splint with 71.13%
percentage of mass reduction as the 71.13% splint mass-produced reasonable mechanical properties
International Journal of Bioprinting (2020)–Volume 6, Issue 2 23