
Page 70 - IJB-6-2
P. 70
Carbon nanomaterials reinforced scaffolds for bone repair
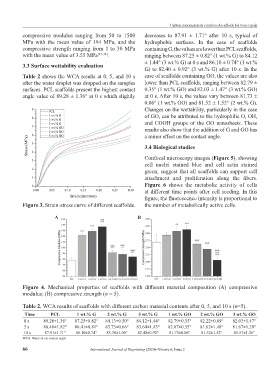
compressive modulus ranging from 50 to 1500 decreases to 87.91 ± 1.71° after 10 s, typical of
MPa with the mean value of 194 MPa, and the hydrophobic surfaces. In the case of scaffolds
compressive strength ranging from 1 to 30 MPa containing G, the values are lower than PCL scaffolds,
with the mean value of 3.55 MPa [35-38] . ranging between 87.25 ± 0.82° (1 wt.% G) to 84.12
± 1.44° (3 wt.% G) at 0 s and 86.10 ± 0.74° (1 wt.%
3.3 Surface wettability evaluation
G) to 82.40 ± 0.92° (3 wt.% G) after 10 s. In the
Table 2 shows the WCA results at 0, 5, and 10 s case of scaffolds containing GO, the values are also
after the water droplet was dropped on the samples lower than PCL scaffolds, ranging between 82.79 ±
surfaces. PCL scaffolds present the highest contact 0.35° (1 wt.% GO) and 82.03 ± 1.47° (3 wt.% GO)
angle value of 89.28 ± 1.36° at 0 s which slightly at 0 s. After 10 s, the values vary between 81.73 ±
0.06° (1 wt.% GO) and 81.52 ± 1.52° (2 wt.% G).
Changes on the wettability, particularly in the case
of GO, can be attributed to the hydrophilic O, OH,
and COOH groups of the GO nanosheets. These
results also show that the addition of G and GO has
a minor effect on the contact angle.
3.4 Biological studies
Confocal microscopy images (Figure 5), showing
cell nuclei stained blue and cell actin stained
green, suggest that all scaffolds can support cell
attachment and proliferation along the fibers.
Figure 6 shows the metabolic activity of cells
at different time points after cell seeding. In this
figure, the fluorescence intensity is proportional to
Figure 3. Strain-stress curve of different scaffolds. the number of metabolically active cells.
A B
Figure 4. Mechanical properties of scaffolds with different material composition (A) compressive
modulus; (B) compressive strength (n = 5).
Table 2. WCA results of scaffolds with different carbon material contents after 0, 5, and 10 s (n=5).
Time PCL 1 wt.% G 2 wt.% G 3 wt.% G 1 wt.% GO 2 wt.% GO 3 wt.% GO
0 s 89.28±1.36° 87.25±0.82° 84.13±0.50° 84.12±1.44° 82.79±0.35° 82.22±0.89° 82.03±1.47°
5 s 88.48±1.82° 86.41±0.81° 83.73±0.66° 83.64±1.43° 82.07±0.35° 81.62±1.48° 81.67±1.28°
10 s 87.91±1.71° 86.10±0.74° 83.30±1.06° 82.40±0.92° 81.73±0.06° 81.52±1.52° 81.57±1.26°
WCA: Water-in-air contact angle
66 International Journal of Bioprinting (2020)–Volume 6, Issue 2