
Page 69 - IJB-6-2
P. 69
Hou, et al.
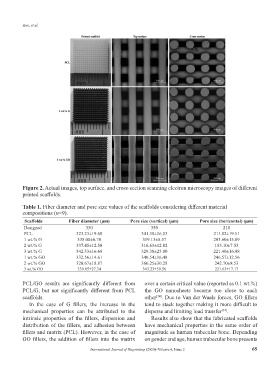
Figure 2. Actual images, top surface, and cross-section scanning electron microscopy images of different
printed scaffolds.
Table 1. Fiber diameter and pore size values of the scaffolds considering different material
compositions (n=9).
Scaffolds Fiber diameter (μm) Pore size (vertical) (μm) Pore size (horizontal) (μm)
Designed 330 350 210
PCL 323.23±19.68 341.38±16.03 211.82±19.51
1 wt.% G 338.00±6.78 319.13±5.57 203.60±15.89
2 wt.% G 337.45±12.58 316.63±12.82 183.10±7.53
3 wt.% G 342.33±16.69 329.38±23.00 221.40±16.98
1 wt.% GO 332.56±14.61 340.54±16.48 246.57±12.56
2 wt.% GO 320.67±18.87 366.25±30.28 242.70±8.53
3 wt.% GO 339.05±27.34 343.23±39.56 221.63±17.17
PCL/GO results are significantly different from over a certain critical value (reported as 0.1 wt.%)
PCL/G, but not significantly different from PCL the GO nanosheets become too close to each
scaffolds. other . Due to Van der Waals forces, GO fillers
[34]
In the case of G fillers, the increase in the tend to stack together making it more difficult to
mechanical properties can be attributed to the disperse and limiting load transfer .
[34]
intrinsic properties of the fillers, dispersion and Results also show that the fabricated scaffolds
distribution of the fillers, and adhesion between have mechanical properties in the same order of
fillers and matrix (PCL). However, in the case of magnitude as human trabecular bone. Depending
GO fillers, the addition of fillers into the matrix on gender and age, human trabecular bone presents
International Journal of Bioprinting (2020)–Volume 6, Issue 2 65