
Page 68 - IJB-6-2
P. 68
Carbon nanomaterials reinforced scaffolds for bone repair
containing 0.001% Alamar Blue (Sigma-Aldrich, A B C
UK) was added to each well and incubated at
standard conditions for 4 h. Then, 150 μL liquid
from each well was transferred into a 96-well plate
and the fluorescence intensity was measured by a
Multi-Detection Microplate Reader Synergy HT
(BioTec, USA) (excitation wavelength of 530 nm
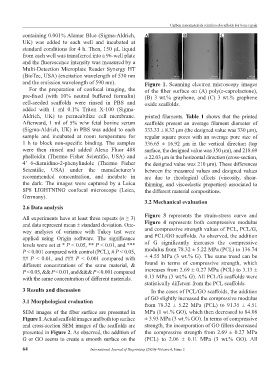
and the emission wavelength of 590 nm). Figure 1. Scanning electron microscopy images
For the preparation of confocal imaging, the of the fiber surface on (A) poly(ε-caprolactone),
pre-fixed (with 10% neutral buffered formalin) (B) 3 wt.% graphene, and (C) 3 wt.% graphene
cell-seeded scaffolds were rinsed in PBS and oxide scaffolds.
added with 1 ml 0.1% Triton X-100 (Sigma-
Aldrich, UK) to permeabilize cell membrane. printed filaments. Table 1 shows that the printed
Afterward, 1 ml of 5% w/w fetal bovine serum scaffolds present an average filament diameter of
(Sigma-Aldrich, UK) in PBS was added to each 333.33 ± 8.32 μm (the designed value was 330 μm),
sample and incubated at room temperature for regular square pores with an average pore size of
1 h to block non-specific binding. The samples 336.65 ± 16.92 μm in the vertical direction (top
were then rinsed and added Alexa Fluor 488 surface, the designed value was 350 μm), and 218.69
phalloidin (Thermo Fisher Scientific, USA) and ± 22.03 μm in the horizontal direction (cross-section,
4’ 6-diamidino-2-phenylindole (Thermo Fisher the designed value was 210 μm). These differences
Scientific, USA) under the manufacturer’s between the measured values and designed values
recommended concentration, and incubate in are due to rheological effects (viscosity, shear-
the dark. The images were captured by a Leica thinning, and viscoelastic properties) associated to
SP8 LIGHTNING confocal microscope (Leica, the different material compositions.
Germany).
3.2 Mechanical evaluation
2.6 Data analysis
All experiments have at least three repeats (n ≥ 3) Figure 3 represents the strain-stress curve and
and data represent mean ± standard deviation. One- Figure 4 represents both compressive modulus
way analyses of variance with Tukey test were and compressive strength values of PCL, PCL/G,
applied using Origin software. The significance and PCL/GO scaffolds. As observed, the addition
levels were set at * P < 0.05, ** P < 0.01, and *** of G significantly increases the compressive
P < 0.001 compared with control (PCL), # P < 0.05, modulus from 78.32 ± 5.22 MPa (PCL) to 136.74
## P < 0.01, and ### P < 0.001 compared with ± 4.55 MPa (3 wt.% G). The same trend can be
different concentrations of the same material, & found in terms of compressive strength, which
P < 0.05, && P < 0.01, and &&& P < 0.001 compared increases from 2.69 ± 0.27 MPa (PCL) to 3.13 ±
with the same concentration of different materials. 0.13 MPa (3 wt.% G). All PCL/G scaffolds were
statistically different from the PCL scaffolds.
3 Results and discussion In the cases of PCL/GO scaffolds, the addition
of GO slightly increased the compressive modulus
3.1 Morphological evaluation
from 78.32 ± 5.22 MPa (PCL) to 91.35 ± 4.51
SEM images of the fiber surface are presented in MPa (1 wt.% GO), which then decreased to 84.08
Figure 1. Actual scaffold images and both top surface ± 3.93 MPa (3 wt.% GO). In terms of compressive
and cross-section SEM images of the scaffolds are strength, the incorporation of GO fillers decreased
presented in Figure 2. As observed, the addition of the compressive strength from 2.69 ± 0.27 MPa
G or GO seems to create a smooth surface on the (PCL) to 2.06 ± 0.11 MPa (3 wt.% GO). All
64 International Journal of Bioprinting (2020)–Volume 6, Issue 2