
Page 8 - IJB-6-4
P. 8
3D printed and electrospun
A
B C D
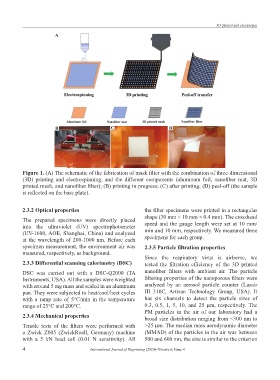
Figure 1. (A) The schematic of the fabrication of mask filter with the combination of three-dimensional
(3D) printing and electrospinning, and the different components (aluminum foil, nanofiber mat, 3D
printed mesh, and nanofiber filter); (B) printing in progress; (C) after printing; (D) peel-off (the sample
is reflected on the base plate).
2.3.2 Optical properties the filter specimens were printed in a rectangular
The prepared specimens were directly placed shape (30 mm × 10 mm × 0.4 mm). The crosshead
into the ultraviolet (UV) spectrophotometer speed and the gauge length were set at 10 mm/
(UV-1600, AOE, Shanghai, China) and analyzed min and 10 mm, respectively. We measured three
at the wavelength of 200-1000 nm. Before each specimens for each group.
specimen measurement, the environment air was 2.3.5 Particle filtration properties
measured, respectively, as background.
Since the respiratory virus is airborne, we
2.3.3 Differential scanning calorimetry (DSC) tested the filtration efficiency of the 3D printed
DSC was carried out with a DSC-Q2000 (TA nanofiber filters with ambient air. The particle
Instruments, USA). All the samples were weighted filtering properties of the nanoporous filters were
with around 5 mg mass and sealed in an aluminum analyzed by an aerosol particle counter (Lasair
pan. They were subjected to heat/cool/heat cycles III 310C, Artisan Technology Group, USA). It
with a ramp rate of 5°C/min in the temperature has six channels to detect the particle sizes of
range of 25°C and 200°C. 0.3, 0.5, 1, 5, 10, and 25 μm, respectively. The
PM particles in the air of our laboratory had a
2.3.4 Mechanical properties broad size distribution ranging from <300 nm to
Tensile tests of the filters were performed with >25 μm. The median mass aerodynamic diameter
a Zwick Z005 (ZwickRoell, Germany) machine (MMAD) of the particles in the air was between
with a 5 kN load cell (0.01 N sensitivity). All 500 and 600 nm, the size is similar to the criterion
4 International Journal of Bioprinting (2020)–Volume 6, Issue 4